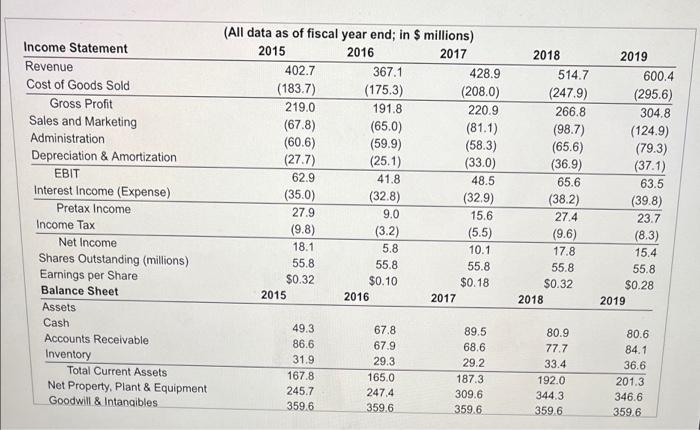
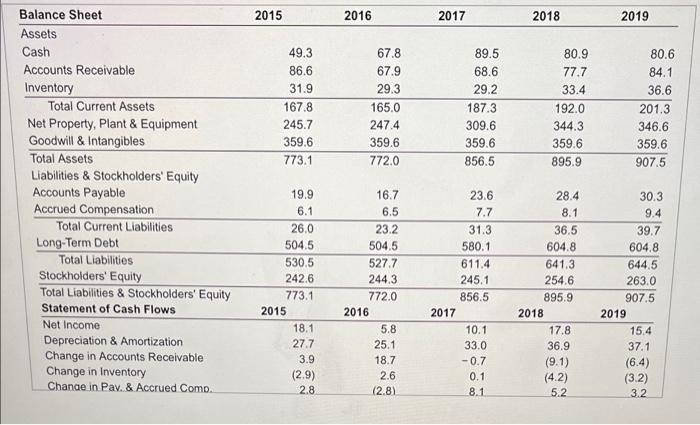
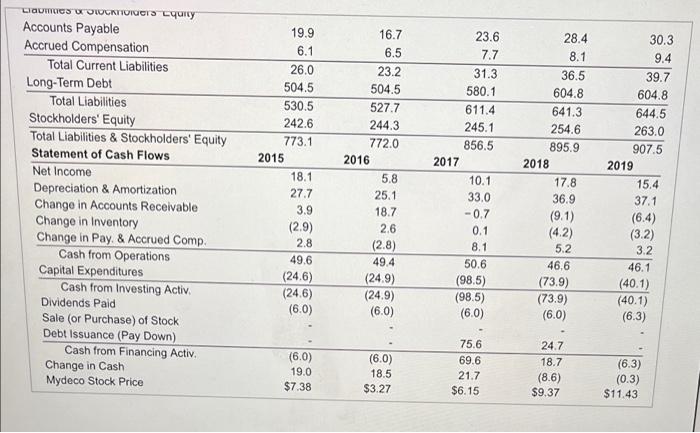
See Table 25 showing financial statement data and stock price data for Mydeco Corp. a. How did Mydeco's accounts receivable days change over this period? b. How did Mydeco's inventory days change over this period? c. Based on your analysis, has Mdeco improved its management of its working capital during this time period? (Note: Use a 365-day year.) a. How did Mydeco's accounts receivable days change over this period? The accounts receivable days for 2015 is days. (Round to one decimal place.) 2018 Income Statement Revenue Cost of Goods Sold Gross Profit Sales and Marketing Administration Depreciation & Amortization EBIT Interest Income (Expense) Pretax Income Income Tax Net Income Shares Outstanding (millions) Earnings per Share Balance Sheet Assets Cash Accounts Receivable Inventory Total Current Assets Net Property, Plant & Equipment Goodwill & Intangibles (All data as of fiscal year end; in $ millions) 2015 2016 2017 402.7 367.1 428.9 (183.7) (175.3) (208.0) 219.0 191.8 220.9 (67.8) (65.0) (81.1) (60.6) (59.9) (58.3) (27.7) (25.1) (33.0) 62.9 41.8 48.5 (35.0) (32.8) (32.9) 27.9 9.0 15.6 (9.8) (3.2) (5.5) 18.1 5.8 10.1 55.8 55.8 55.8 $0.32 $0.10 $0.18 2015 2016 2017 514.7 (247.9) 266.8 (98.7) (65.6) (36.9) 65.6 (38.2) 27.4 (9.6) 17.8 55.8 $0.32 2018 2019 600.4 (295.6) 304.8 (124.9) (79.3) (37.1) 63.5 (39.8) 23.7 (8.3) 15.4 55.8 $0.28 2019 49.3 86.6 31.9 167.8 245.7 359.6 67.8 67.9 29.3 165.0 247.4 359.6 89.5 68.6 29.2 187.3 309.6 359.6 80.9 77.7 33.4 192.0 344.3 359.6 80.6 84.1 36.6 201.3 346.6 359.6 2015 2016 2017 2018 2019 80.9 77.7 49.3 86.6 31.9 167.8 245.7 359.6 773.1 67.8 67.9 29.3 165.0 247.4 359,6 772.0 89.5 68.6 29.2 187.3 309.6 359.6 856.5 33.4 192.0 344.3 359.6 895.9 80.6 84.1 36.6 201.3 346.6 359.6 907.5 Balance Sheet Assets Cash Accounts Receivable Inventory Total Current Assets Net Property, Plant & Equipment Goodwill & Intangibles Total Assets Liabilities & Stockholders' Equity Accounts Payable Accrued Compensation Total Current Liabilities Long-Term Debt Total Liabilities Stockholders' Equity Total Liabilities & Stockholders' Equity Statement of Cash Flows Net Income Depreciation & Amortization Change in Accounts Receivable Change in Inventory Change in Pav. & Accrued Comp. 19.9 6.1 26.0 504.5 530.5 242.6 773.1 2015 18.1 27.7 3.9 (2.9) 2.8 16.7 6.5 23.2 504.5 527.7 244.3 772.0 2016 5.8 25.1 18.7 2.6 (2.8) 23.6 7.7 31.3 580.1 611.4 245.1 856.5 2017 10.1 33.0 -0.7 0.1 8.1 28.4 8.1 36.5 604.8 641.3 254.6 895.9 2018 17.8 36.9 (9.1) (4.2) 5.2 30.3 9.4 39.7 604.8 644.5 263.0 907.5 2019 15.4 37.1 (6.4) (3.2) 3.2 LIGUNCIOS VOITTOIVOIS Lquity Accounts Payable Accrued Compensation Total Current Liabilities Long-Term Debt Total Liabilities Stockholders' Equity Total Liabilities & Stockholders' Equity Statement of Cash Flows Net Income Depreciation & Amortization Change in Accounts Receivable Change in Inventory Change in Pay. & Accrued Comp. Cash from Operations Capital Expenditures Cash from Investing Activ. Dividends Paid Sale (or Purchase) of Stock Debt Issuance (Pay Down) Cash from Financing Activ Change in Cash Mydeco Stock Price 19.9 6.1 26.0 504.5 530.5 242.6 773.1 2015 18.1 27.7 3.9 (2.9) 2.8 49.6 (24.6) (24.6) (6.0) 16.7 6.5 23.2 504.5 527.7 244.3 772.0 2016 5.8 25.1 18.7 2.6 (2.8) 49.4 (24.9) (24.9) (6.0) 23.6 7.7 31.3 580.1 611.4 245.1 856.5 2017 10.1 33.0 -0.7 0.1 8.1 50.6 (98.5) (98.5) (6.0) 28.4 8.1 36.5 604.8 641.3 254.6 895.9 2018 17.8 36.9 (9.1) (4.2) 5.2 46.6 (73.9) (73.9) (6.0) 30.3 9.4 39.7 604.8 644.5 263.0 907.5 2019 15.4 37.1 (6.4) (32) 3.2 46.1 (40.1) (40.1) (6.3) (6.0) 19.0 $7.38 (6.0) 18.5 $3.27 75.6 69.6 21.7 $6.15 24.7 18.7 (8.6) $9.37 (6.3) (0.3) $11.43