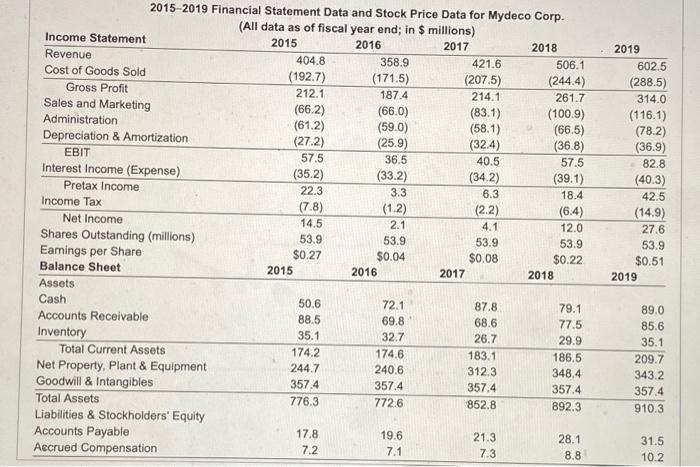
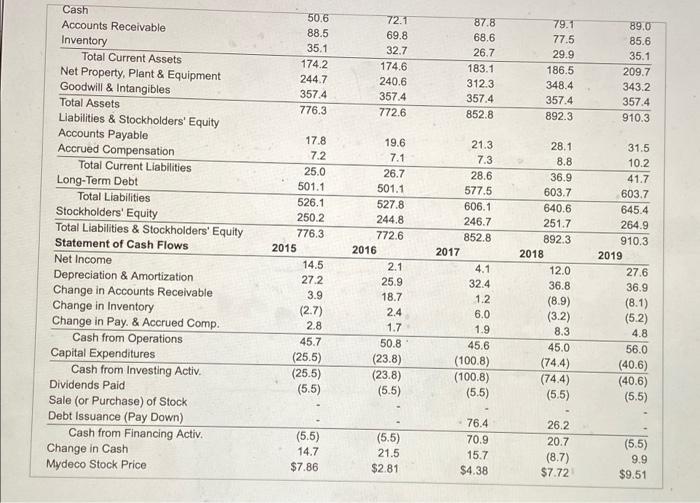
See Table 2.5 showing financial statement data and stock price data for Mydeco Corp. Was Mydeco able to improve its return on invested capital (ROIC) in 2019 relative to what it was in 2015? The ROIC for 2015 is %. (Round to two decimal places.) 2015-2019 Financial Statement Data and Stock Price Data for Mydeco Corp. (All data as of fiscal year end; in $ millions) Income Statement 2015 2016 2017 2018 Revenue 404.8 358.9 421.6 506.1 Cost of Goods Sold (1927) (171.5) (207.5) (244.4) Gross Profit 212.1 187.4 214.1 261.7 Sales and Marketing (662) (66.0) (83.1) (100.9) Administration (61.2) (59.0) (58.1) (66.5) Depreciation & Amortization (272) (25.9) (32.4) (36.8) EBIT 57.5 36.5 40.5 57.5 Interest Income (Expense) (35.2) (33.2) (34.2) (39.1) Pretax Income 22.3 3.3 6.3 18.4 Income Tax (7.8) (1.2) (2.2) (6.4) Net Income 14.5 2.1 4.1 12.0 Shares Outstanding (millions) 53.9 53.9 53.9 53.9 Earnings per Share $0.27 $0.04 $0.08 $0.22 Balance Sheet 2015 2016 2017 2018 Assets Cash 50.6 72.1 87.8 79.1 Accounts Receivable 88.5 69.8 68.6 77.5 Inventory 35.1 32.7 26.7 29.9 Total Current Assets 174.2 174,6 183.1 186.5 Net Property, Plant & Equipment 244.7 240.6 312.3 348.4 Goodwill & Intangibles 357.4 357.4 357.4 357.4 Total Assets 776.3 772.6 852.8 892.3 Liabilities & Stockholders' Equity Accounts Payable 17.8 19.6 21.3 28.1 Accrued Compensation 7.2 7.1 7.3 8.8 2019 602.5 (288.5) 314.0 (116.1) (78.2) (36.9) 82.8 (40.3) 42.5 (14.9) 27.6 53.9 $0.51 2019 89.0 85.6 35.1 209.7 343.2 357.4 910.3 21 31.5 10.2 50.6 88.5 35.1 174.2 244.7 357.4 776.3 72.1 69.8 32.7 174.6 240.6 357.4 772.6 87.8 68.6 26.7 183.1 312.3 357.4 852.8 79.1 77.5 29.9 186.5 348.4 357.4 892.3 89.0 85.6 35.1 209.7 343.2 357.4 910.3 Cash Accounts Receivable Inventory Total Current Assets Net Property, Plant & Equipment Goodwill & Intangibles Total Assets Liabilities & Stockholders' Equity Accounts Payable Accrued Compensation Total Current Liabilities Long-Term Debt Total Liabilities Stockholders' Equity Total Liabilities & Stockholders' Equity Statement of Cash Flows Net Income Depreciation & Amortization Change in Accounts Receivable Change in Inventory Change in Pay. & Accrued Comp. Cash from Operations Capital Expenditures Cash from Investing Activ. Dividends Paid Sale (or Purchase) of Stock Debt Issuance (Pay Down) Cash from Financing Activ. Change in Cash Mydeco Stock Price 17.8 7.2 25.0 501.1 526.1 250.2 776.3 2015 14.5 27.2 3.9 (2.7) 2.8 45.7 (25.5) (25.5) 19.6 7.1 26.7 501.1 527.8 244.8 772.6 2016 2.1 25.9 18.7 2.4 1.7 50.8 (23.8) (23.8) (5.5) 21.3 7.3 28.6 577.5 606.1 246.7 852.8 2017 4.1 32.4 1.2 6.0 1.9 45.6 (100.8) (100.8) (5.5) 28.1 8.8 36.9 603.7 640.6 251.7 892.3 2018 12.0 36.8 (8.9) (3.2) 8.3 45.0 (74.4) (74.4) (5.5) 31.5 10.2 41.7 603.7 645.4 264.9 910.3 2019 27.6 36.9 (8.1) (5.2) 4.8 56.0 (40.6) (40.6) (5.5) (5.5) (5.5) 14.7 $7.86 (5.5) 21.5 $2.81 76.4 70.9 15.7 $4.38 26.2 20.7 (8.7) $7.72 (5.5) 9.9 $9.51