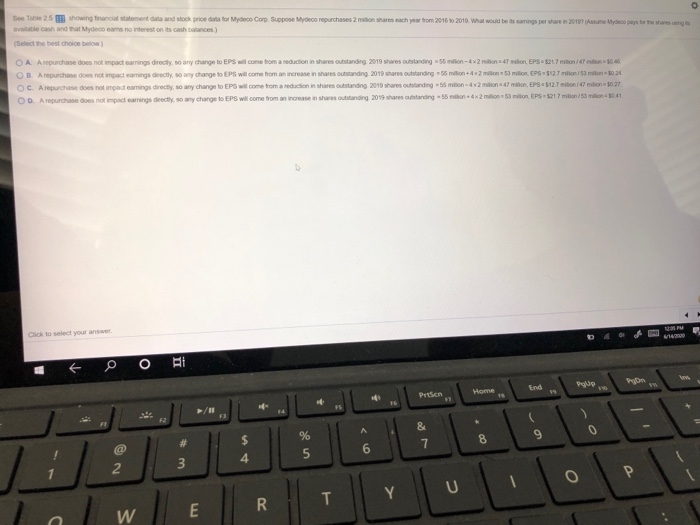
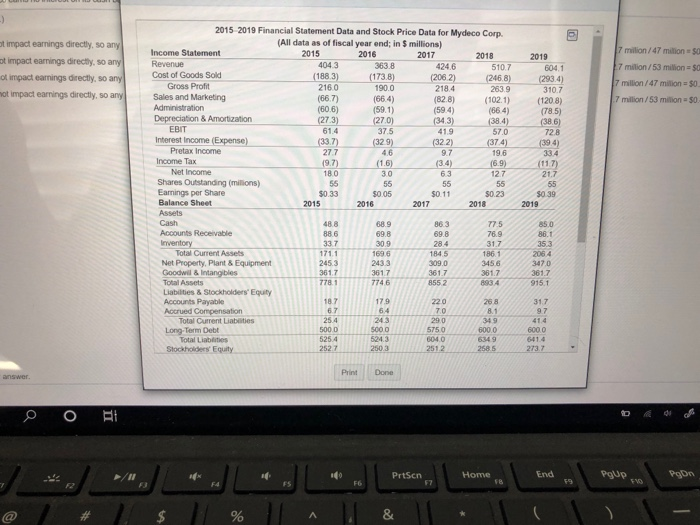
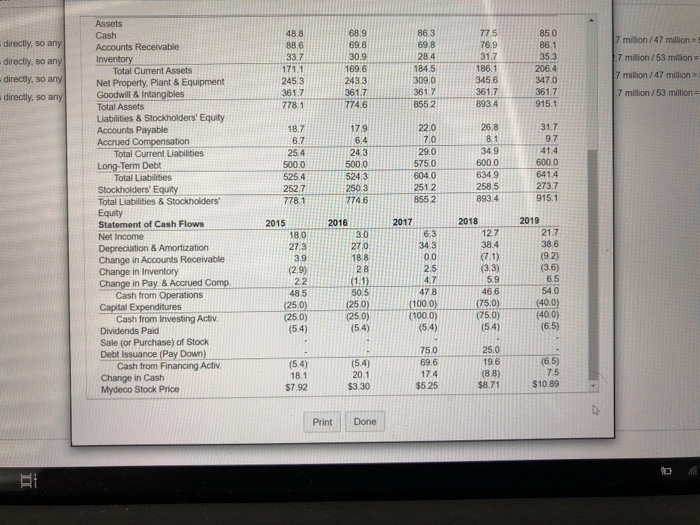
See Table 25 showing francial statement data and stock prices for Mydeco Corp. Suppose Mydeco repurchases 2 more each year from 2016 to 2010. What would be caningsperare in 2018? (sume Myopathe ve cash and that Mydecor no rest on its cash ances) Select the best choice below) OM A repurchase does not impact earnings directly to any change to EPS will come from a reduction in shares outstanding 2019 shares outstanding - 56 milion-4x2 milion = 47 niton, EPS-$2.7 ton/ention $0:46 OB. A repurchase do not accoringsdirectly so any change to EPs will come from an increase in shares outstanding 2019 shares outstanding - 55 milion +4253 P127 min/miton024 OC. A repurchase does not impact earning directly, so any change to EPS wil.com tomanduction in shares standing 2010 ores standing 55 min 42 min mo, EPS-5127/47 milion 5021 OD. A repurchase does not impact camningsdrechy, so any change to EPS wilcome from an increase in shares outstanding 2019 shares outstanding 55 to 2 min ton EPS-$217/3041 Click to select your answer VI 0 BI Und Pop Putson Home $ 75 FI 0 & 7 8 9 % 5 4 2 3 U T za E 20 W -) g 7 million/47 millions at impact earnings directly, so any at impact earnings directly, so any ot impact earnings directly, so any not impact earnings directly, so any 7 milion/53 million = $0 7 million/47 milion = $0 7 million/53 million = $0. 2015 2019 Financial Statement Data and Stock Price Data for Mydeco Corp. (All data as of fiscal year end; in 5 millions) Income Statement 2015 2016 2017 2018 Revenue 4043 363.8 424,6 5107 Cost of Goods Sold (1883) (173.8) (2062) (246.8) Gross Profit 2160 190.0 218.4 263.9 Sales and Marketing (66.7) (66.4) (82.8) (102.1) Administration (60.6) (59.1) (59.4) (66.4) Depreciation & Amortization (273) (27.0) (343) (38.4) EBIT 61.4 37.5 41.9 57.0 Interest Income (Expense) (33.7) (329) (322) (374) Pretax Income 277 4.6 9.7 19.6 Income Tax (9.7) (1.6) (3.4) (6.9) Net Income 180 30 6.3 12.7 Shares Outstanding (millions) 55 55 55 55 Earnings per Share $0.33 30.05 $0.11 $0.23 Balance Sheet 2015 2016 2017 2018 Assets Cash 48.8 68.9 863 775 Accounts Receivable 886 69.8 69.8 76.9 Inventory 337 309 28.4 31.7 Total Current Assets 171.1 1696 1845 1861 Net Property, Plant & Equipment 245.3 2433 309.0 3456 Goodwil & Intangibles 361.7 3617 361.7 361.7 Total Assets 7781 7746 8552 893 4 Liabilities & Stockholders' Equity Accounts Payable 18.7 179 220 268 Accrued Compensation 67 6.4 70 81 Total Current Liabilities 25.4 24.3 29.0 349 Long Term Debt 5000 5000 600.0 Total Liabilities 525.4 5243 604.0 6349 Stockholders Equity 2527 2503 2512 2585 2019 604.1 (293.4) 310.7 (1208) (78.5) (386) 728 (39.4) 334 (117) 21.7 55 $0 39 2019 850 86.1 35.3 2064 3470 361.7 915.1 5750 317 97 41.4 6000 6414 273.7 Print Done answer la O BE PrtScn Home End Pgup PON k F6 F7 59 VO % & 775 48.8 88,6 76.9 337 directly, so any directly, so any directly, so any directly, so any 171.1 245.3 361.7 778.1 68.9 69.8 30.9 169.6 243.3 3617 774.6 863 69.8 28.4 184.5 309.0 361.7 8552 31.7 186.1 3456 361.7 893.4 850 86.1 35.3 206.4 3470 361.7 915.1 7 milion/47 million 7 million/53 milion = 7 million/47 million 7 million/53 million 179 6.4 18.7 6.7 25.4 500.0 525.4 2527 778.1 24.3 5000 5243 250.3 7746 220 70 29.0 5750 604.0 2512 8552 26.8 8.1 34.9 600.0 634.9 2585 893.4 31.7 9.7 41.4 6000 641.4 273.7 915.1 Assets Cash Accounts Receivable Inventory Total Current Assets Net Property. Plant & Equipment Goodwill & Intangibles Total Assets Liabilities & Stockholders' Equity Accounts Payable Accrued Compensation Total Current Liabilities Long-Term Debt Total Liabilities Stockholders' Equity Total Liabilities & Stockholders Equity Statement of Cash Flows Net Income Depreciation & Amortization Change in Accounts Receivable Change in Inventory Change in Pay & Accrued Comp Cash from Operations Capital Expenditures Cash from investing Activ Dividends Paid Sale (or Purchase) of Stock Debt Issuance (Pay Down) Cash from Financing Activ Change in Cash Mydeco Stock Price 2016 30 2015 18.0 27.3 3.9 (2.9) 22 48.5 (250) (25.0) (5.4) 270 18.8 28 (1.1) 50.5 (250) (25.0) (5.4) 2017 6.3 34.3 0.0 2.5 4.7 47.8 (1000) (100.0) (5.4) 2018 12.7 38.4 (7.1) (3.3) 5.9 46.6 (75.0) (75.0) (5.4) 2019 21.7 38.6 (9.2) (36) 6.5 54.0 (40.0) (40.0) (6.5) (5.4) 18.1 $7.92 (5.4) 20.1 $3.30 750 69.6 174 $5.25 25.0 19.6 (88) $8.71 (6.5) 75 $10.89 Print Done D


