

Answered step by step
Verified Expert Solution
Question
1 Approved Answer
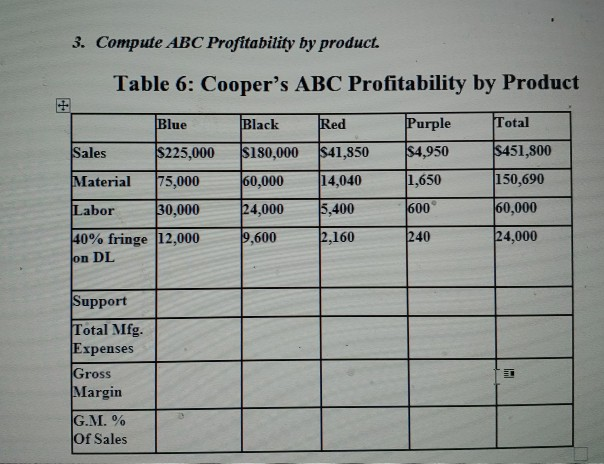
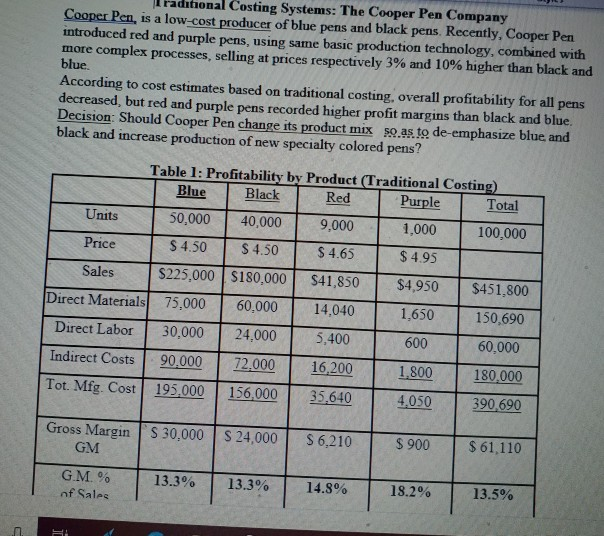
see the I formations below No additional information. thanks Compute ABC Profitability by product. 3. Table 6: Cooper's ABC Profitability by Product Purple Total Blue
see the I formations below
No additional information. thanks
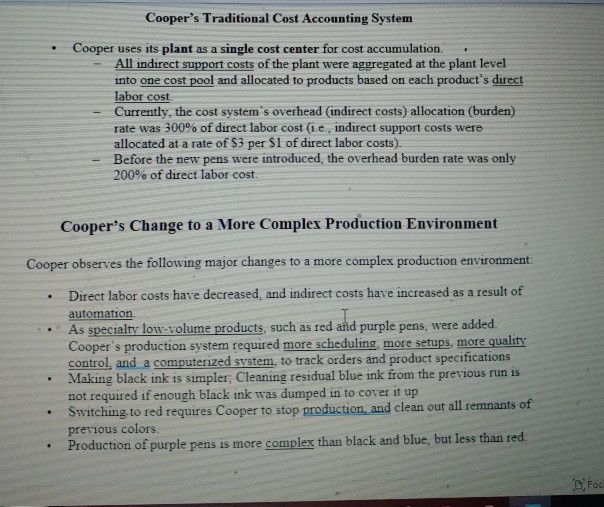
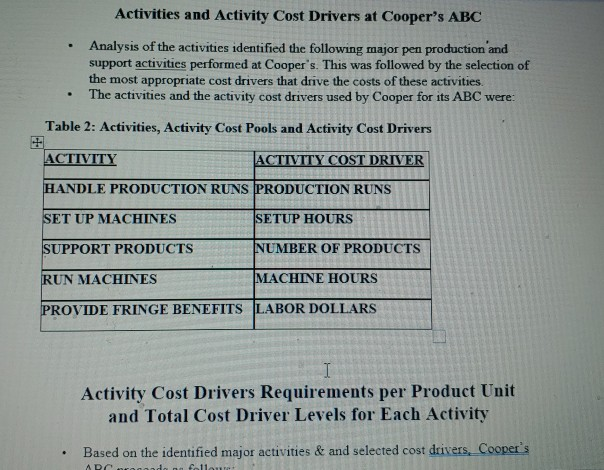
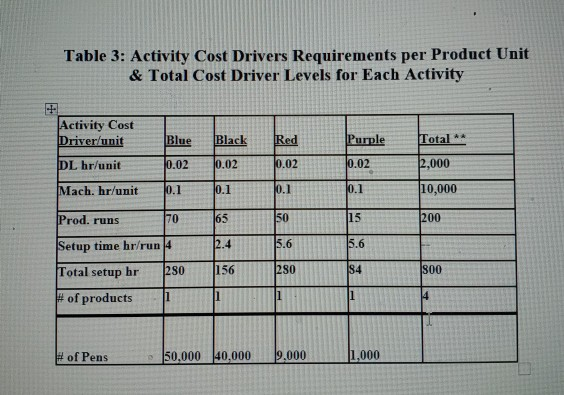
Compute ABC Profitability by product. 3. Table 6: Cooper's ABC Profitability by Product Purple Total Blue Black Red $451,800 $4,950 $225,000 Sales s180,000 $41,850 1,650 150,690 Material 75,000 60,000 14,040 60,000 600 Labor 30,000 24,000 5,400 24,000 2,160 240 40% fringe 12,000 9,600 on DL Support Total Mfg. Expenses Gross Margin G.M. % Of Sales nal Costing Systems: The Cooper Pen Company Cooper Pen, is a low-cost producer of blue pens and black pens. Recently, Cooper Pen introduced red and purple pens, using same basic production technology, combined with more complex processes, selling at prices respectively 3 % and 10 % higher than black and blue. According to cost estimates based on traditional costing, overall profitability for all pens decreased, but red and purple pens recorded higher profit margins than black and blue. Decision: Should Cooper Pen change its product mix so as to de-emphasize blue and black and increase production of new specialty colored pens? Table 1: Profitability by Product (Traditional Costing) Blue Black Red Purple Total Units 50,000 40,000 9,000 1,000 100,000 Price S 4.50 S 4.50 $ 4.65 $4.95 $225,000 $180,000 Sales $41,850 $4,950 $451,800 Direct Materials 75,000 60,000 14,040 1,650 150,690 Direct Labor 30,000 24,000 5,400 600 60,000 Indirect Costs 90,000 72,000 16,200 1,800 180,000 Tot. Mfg. Cost 195,000 156,000 35,640 4.050 390,690 Gross MarginS 30,000 S 24,000 S 6,210 $ 61,110 $900 GM G.M. % 13.3% 13.3% 14.8% 18.2% 13.5% of Sales Cooper's Traditional Cost Accounting System Cooper uses its plant as a single cost center for cost accumulation. All indirect support costs of the plant were aggregated at the plant level into one cost pool and allocated to products based on each product's direct labor cost Currently, the cost system's overhead (indirect costs) allocation (burden) rate was 300% of direct labor cost (1.e., indirect support costs were allocated at a rate of $3 per $1 of direct labor costs). Before the new pens were introduced, the overhead burden rate was only 200% of direct labor cost. Cooper's Change to a More Complex Production Environment Cooper observes the following major changes to a more complex production environment Direct labor costs have decreased, and indirect costs have increased as a result of automation As specialty low-volume products, such as red and purple pens, were added. Cooper's production system required more scheduling, more setups, more quality control, and a computerized system, to track orders and product specifications Making black ink is simpler; Cleaning residual blue ink from the previous run is not required if enough black ink was dumped in to cover it up Switching to red requires Cooper to stop production and clean out all remnants of previous colors. Production of purple pens is more complex than black and blue, but less than red. Foc Activities and Activity Cost Drivers at Cooper's ABC Analysis of the activities identified the following major pen production and support activities performed at Cooper's. This was followed by the selection of the most appropriate cost drivers that drive the costs of these activities. The activities and the activity cost drivers used by Cooper for its ABC were: Table 2: Activities, Activity Cost Pools and Activity Cost Drivers CTIVITY ACTIVITY COST DRIVER HANDLE PRODUCTION RUNS PRODUCTION RUNS SET UP MACHINES SETUP HOURS SUPPORT PRODUCTS NUMBER OF PRODUCTS MACHINE HOURS RUN MACHINES PROVIDE FRINGE BENEFITS LABOR DOLLARS Activity Cost Drivers Requirements per Product Unit and Total Cost Driver Levels for Each Activity Based on the identified major activities & and selected cost drivers, Cooper's ARC nronoode followe Table 3: Activity Cost Drivers Requirements per Product Unit & Total Cost Driver Levels for Each Activity Activity Cost Driver/unit Blue Black Purple Total ** Red 0.02 2,000 0.02 0.02 0.02 DL hr/unit 0.1 10,000 0.1 Mach. hr/unit 0.1 0.1 50 65 15 200 70 Prod. runs 2.4 5.6 5.6 Setup time hr/run 4 156 84 280 280 800 Total setup hr # of products 1 1,000 # of Pens 50,000 40,000 9.000 4. Compare Cooper's ABC Profitability Report to Cooper's Traditional Profitability Report. Discuss which Profitability Report is likely to be more urate. 5. How can Cooper use its ABC Results to plan for improve performance in production, cost management, marketing, and profitability? 6. If ABC results bring to changes in Cooper's strategies, please design procedure for estimating the value added of the ABC information to Cooper relative to the additional cost of ABC implementation? Please describe the major cost and value added components. I olufemi bababu Last saved by user Compatibility Mode Saved to this PC Assignment 3 Off O Search Help View Review Mailings References gn Layout AaBbCcl AaBbC AaBbCcI AaBbCel AaBbCcD Aa ew Rorr 12 A A Aa Ap Strong Subtitle T Normal Emphasis Heading 1 DA y-ab x, xA Styles Paragraph Font Reason for Cost Distortions in Cooper's Traditional Costing Systems Cooper identifies the following main reasons for growing cost distortion: Cooper's traditional costing system uses the same burden rate for all pens in allocating indirect costs. This practice is based on the implicit assumption that the production systems for all pens are of about the same complexity. As a result, Cooper's traditional costing system would report essentially identical indirect costs per direct labor dollar unit for all pens, standard and specialty In reality, considerably more indirect and support resources are of direct labor for the low-volume, newly designed red and purple pens than for the high-volume, standard blue and black pens. Hence, Cooper's traditional costing system over-allocates indirect costs to Blue and black pens, and under-allocates indirect costs to red and purple pens. required per dollar ABC Systems: General Procedures In general, Cooper decides to pursue the following procedures, common to most ABC Systems use the following procedures: T 1. Detailed analysis of the sequence of activities performed 2. Identification of the resources required for each activity 3. Estimation of the cost of performing each activity by pooling same activity costs into separate activity cost pools. 4. Choice of the most appropriate cost driver for the costs of each activity 5. Determination of the level of the cost driver made available by the resources committed to each activity. DFocus h Compute ABC Profitability by product. 3. Table 6: Cooper's ABC Profitability by Product Purple Total Blue Black Red $451,800 $4,950 $225,000 Sales s180,000 $41,850 1,650 150,690 Material 75,000 60,000 14,040 60,000 600 Labor 30,000 24,000 5,400 24,000 2,160 240 40% fringe 12,000 9,600 on DL Support Total Mfg. Expenses Gross Margin G.M. % Of Sales nal Costing Systems: The Cooper Pen Company Cooper Pen, is a low-cost producer of blue pens and black pens. Recently, Cooper Pen introduced red and purple pens, using same basic production technology, combined with more complex processes, selling at prices respectively 3 % and 10 % higher than black and blue. According to cost estimates based on traditional costing, overall profitability for all pens decreased, but red and purple pens recorded higher profit margins than black and blue. Decision: Should Cooper Pen change its product mix so as to de-emphasize blue and black and increase production of new specialty colored pens? Table 1: Profitability by Product (Traditional Costing) Blue Black Red Purple Total Units 50,000 40,000 9,000 1,000 100,000 Price S 4.50 S 4.50 $ 4.65 $4.95 $225,000 $180,000 Sales $41,850 $4,950 $451,800 Direct Materials 75,000 60,000 14,040 1,650 150,690 Direct Labor 30,000 24,000 5,400 600 60,000 Indirect Costs 90,000 72,000 16,200 1,800 180,000 Tot. Mfg. Cost 195,000 156,000 35,640 4.050 390,690 Gross MarginS 30,000 S 24,000 S 6,210 $ 61,110 $900 GM G.M. % 13.3% 13.3% 14.8% 18.2% 13.5% of Sales Cooper's Traditional Cost Accounting System Cooper uses its plant as a single cost center for cost accumulation. All indirect support costs of the plant were aggregated at the plant level into one cost pool and allocated to products based on each product's direct labor cost Currently, the cost system's overhead (indirect costs) allocation (burden) rate was 300% of direct labor cost (1.e., indirect support costs were allocated at a rate of $3 per $1 of direct labor costs). Before the new pens were introduced, the overhead burden rate was only 200% of direct labor cost. Cooper's Change to a More Complex Production Environment Cooper observes the following major changes to a more complex production environment Direct labor costs have decreased, and indirect costs have increased as a result of automation As specialty low-volume products, such as red and purple pens, were added. Cooper's production system required more scheduling, more setups, more quality control, and a computerized system, to track orders and product specifications Making black ink is simpler; Cleaning residual blue ink from the previous run is not required if enough black ink was dumped in to cover it up Switching to red requires Cooper to stop production and clean out all remnants of previous colors. Production of purple pens is more complex than black and blue, but less than red. Foc Activities and Activity Cost Drivers at Cooper's ABC Analysis of the activities identified the following major pen production and support activities performed at Cooper's. This was followed by the selection of the most appropriate cost drivers that drive the costs of these activities. The activities and the activity cost drivers used by Cooper for its ABC were: Table 2: Activities, Activity Cost Pools and Activity Cost Drivers CTIVITY ACTIVITY COST DRIVER HANDLE PRODUCTION RUNS PRODUCTION RUNS SET UP MACHINES SETUP HOURS SUPPORT PRODUCTS NUMBER OF PRODUCTS MACHINE HOURS RUN MACHINES PROVIDE FRINGE BENEFITS LABOR DOLLARS Activity Cost Drivers Requirements per Product Unit and Total Cost Driver Levels for Each Activity Based on the identified major activities & and selected cost drivers, Cooper's ARC nronoode followe Table 3: Activity Cost Drivers Requirements per Product Unit & Total Cost Driver Levels for Each Activity Activity Cost Driver/unit Blue Black Purple Total ** Red 0.02 2,000 0.02 0.02 0.02 DL hr/unit 0.1 10,000 0.1 Mach. hr/unit 0.1 0.1 50 65 15 200 70 Prod. runs 2.4 5.6 5.6 Setup time hr/run 4 156 84 280 280 800 Total setup hr # of products 1 1,000 # of Pens 50,000 40,000 9.000 4. Compare Cooper's ABC Profitability Report to Cooper's Traditional Profitability Report. Discuss which Profitability Report is likely to be more urate. 5. How can Cooper use its ABC Results to plan for improve performance in production, cost management, marketing, and profitability? 6. If ABC results bring to changes in Cooper's strategies, please design procedure for estimating the value added of the ABC information to Cooper relative to the additional cost of ABC implementation? Please describe the major cost and value added components. I olufemi bababu Last saved by user Compatibility Mode Saved to this PC Assignment 3 Off O Search Help View Review Mailings References gn Layout AaBbCcl AaBbC AaBbCcI AaBbCel AaBbCcD Aa ew Rorr 12 A A Aa Ap Strong Subtitle T Normal Emphasis Heading 1 DA y-ab x, xA Styles Paragraph Font Reason for Cost Distortions in Cooper's Traditional Costing Systems Cooper identifies the following main reasons for growing cost distortion: Cooper's traditional costing system uses the same burden rate for all pens in allocating indirect costs. This practice is based on the implicit assumption that the production systems for all pens are of about the same complexity. As a result, Cooper's traditional costing system would report essentially identical indirect costs per direct labor dollar unit for all pens, standard and specialty In reality, considerably more indirect and support resources are of direct labor for the low-volume, newly designed red and purple pens than for the high-volume, standard blue and black pens. Hence, Cooper's traditional costing system over-allocates indirect costs to Blue and black pens, and under-allocates indirect costs to red and purple pens. required per dollar ABC Systems: General Procedures In general, Cooper decides to pursue the following procedures, common to most ABC Systems use the following procedures: T 1. Detailed analysis of the sequence of activities performed 2. Identification of the resources required for each activity 3. Estimation of the cost of performing each activity by pooling same activity costs into separate activity cost pools. 4. Choice of the most appropriate cost driver for the costs of each activity 5. Determination of the level of the cost driver made available by the resources committed to each activity. DFocus hStep by Step Solution
There are 3 Steps involved in it
Step: 1

Get Instant Access to Expert-Tailored Solutions
See step-by-step solutions with expert insights and AI powered tools for academic success
Step: 2

Step: 3
Ace Your Homework with AI
Get the answers you need in no time with our AI-driven, step-by-step assistance
Get Started
Regulation A+ How The JOBS Act Creates Opportunities For Entrepreneurs And Investors
Authors: Paul Getty , Dinesh Gupta , Robert R. Kaplan
1st Edition
1430257318,1430257326