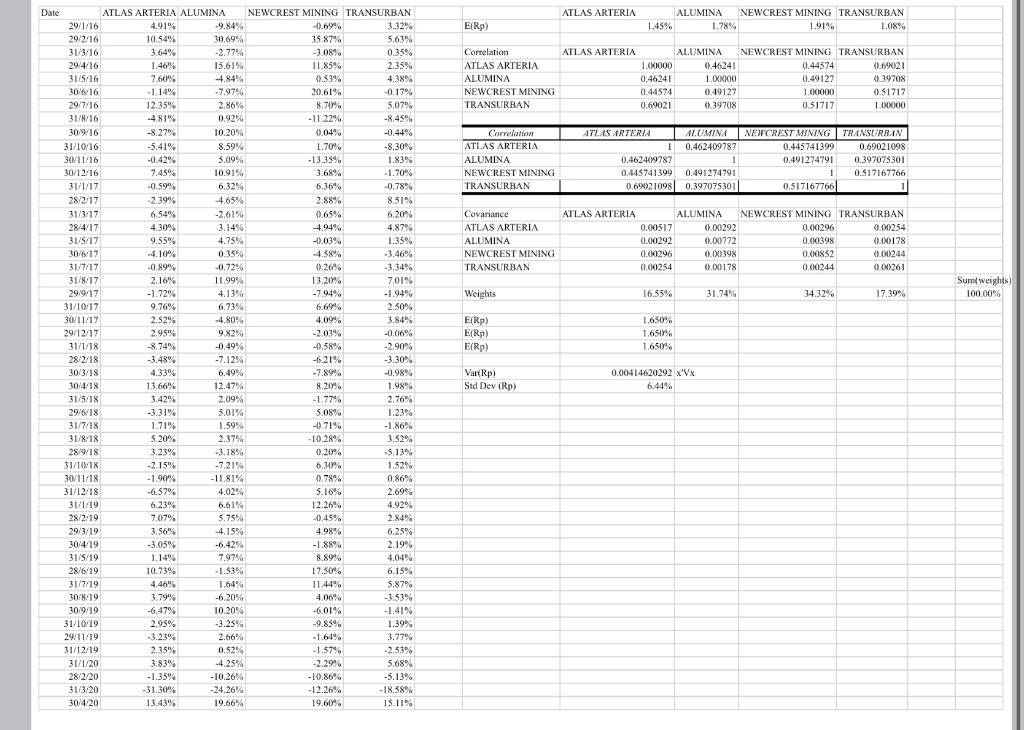
See the Tutorial 3.xlsx spreadsheet on Moodle. Using all of the data provided, determine the risk and historical return of a portfolio that invests an equal amount in both stocks. How does it compare to each stock individually?


ATLAS ARTERIA ALUMINA NEWCREST MINING TRANSURBAN 1.45% 1.78% 1.91% 1.08% E(Rp) ATLAS ARTERIA Correlation ATLAS ARTERIA ALUMINA NEWCREST MINING TRANSURBAN 1.00000 0.46241 0.44574 0.69021 ALUMINA 0.46241 1.OXKIO 0.49127 0.39708 NEWCREST MINING TRANSURBAN 0.44574 0.66021 0.49127 0.39708 1.00000 0.51712 0.51717 100X100 Correlation ATLAS ARTERIA ALUMINA NEWCREST MINING TRANSURBAN ATLAS ARTERIA ALUMINA NEWCREST MINING TRANSURBAN 1 0.462409787 0.445741399 0.69021098 0.462409787 1 0.491274791 0.397075301 0.445741390 0.491274791 1 0.517167766 0.69021098 0.397075301 0.517167766 1 Covariance ATLAS ARTERIA ALUMINA NEWCREST MINING TRANSURBAN ATLAS ARTERIA ALUMINA NEWCREST MINING TRANSURBAN 0.00517 0.00292 0.00296 0.00254 0.00292 0.00772 0.00398 0.00178 0.00296 0.00398 0.00852 0.00244 0.00254 0.00178 0.00244 0.00261 Weights Sumweights) 100.0096 16.55% 31.749 34.32% 17.39% E(Rp) E(Rp) E(Rp) 1.6504 1.650% 1.650% Date ATLAS ARTERIA ALUMINA NEWCREST MINING TRANSURBAN 29/1/16 4.91% 9.84% -0.69% 3.32% 29/2/16 10.54% 30.69% 35.87% 5.63% 31/3/16 3.64% -2.77% -3.08% 0.35% 29/4/16 1.46% 15.61% 11.85% 2.35% 31/5/16 7.60% -4.84% 0.53% 4,38% 30/6/16 -1.14% -7.97% 20.61% -0.17% 29/7/16 12.35% 2.86% 8.70% 5.07% 31/8/16 -4,81% 0.92% - 11.229 -8.45% 30/9/16 -8.27% 10.20% 0.04% -0.44% 31/10/16 -5.41% 8.59% 1.70% -8.30% 30/11/16 -0.42% 3.09% -13.35% 1.83% 30/12/16 7.45% 10.91% 3.68% - 1.70% 31/1/17 -0.59% 6.32% 6.36% -0.78% 28/2/17 -2.39% -4.65% 2.88% 8.51% 31/3/17 6.54% -2.61% 0.65% 6.20 28/4/17 4.30% 3.14% 4.94% 4.87% 31/5/17 9.55% 4.75% -0.03% 1.35% 30/6/17 -4.10% 0.35% -4.58% -3,46% 31/7/17 -0.89% -0.72% 0.26% 31/8/17 2.16% 11.99% 13,20% 7.01% 29/9/17 -1.72% 4.13% -7.94% -1.94% 31/10/17 9.76% 6.73% 2.30% 30/11/17 2.52% -4.80% 4.09% 3.84% 29/12/17 2.95% 9.82% -2.03% -0.06% 31/1/18 -8.74% -0.49% -0.58% -2.90% 28/2/18 -3.48% -7.12% -6.21% -3.30% 30/3/18 4.33% 6.49% -7.896 -0.98% 30/4/18 13,66% 12.47% 8.21% 1.98% 31/5/18 3.42% 2.09% -1.77% 2.76% 29/6/18 -3.31% 5.01% 5.08% 1.23% 31/7/18 1.71% 1.59% -0.71% -1.86% 31/8/18 5.20% 2.37% -10.28% 3.52% 28/9/18 3.23% -3.18% 0.20% -5.13% 31/10/18 -2.15% -7.21% 6.30% 1.52% 30/11/18 -1.90% -11,81% 0.78% 0.86% 31/12/18 -6.57% 4.02% 5.16% 2.69% 31/1/19 6.23% 6.61% 12.26% 4.92% 28/2/19 7.07% 5.75% -0.45% 2.84% 29/3/19 3.56% % -4.15% 4.98% 6.25% 30/4/19 -3.05% -6.42% -1.88% 2.19% 31/5/19 1.14% 7.97% 8.89% 4.04% 28/6/19 10.73% -1.53% 17.50% 6.15% 31/7/19 4,46% 1.64% 11.44% 5.87 30/8/19 3.79% -6.20% 4.06% -3.53% 30/9/19 -6.47% 10,20% -6.01% -1.41% 31/10/19 2.95% -3.25% -9.85% 1.39% 29/11/19 -3.23% 2.66% 3.77% 31/12/19 2.35% 0.52% -1.57% -2.53% 31/1/20 3.83% -4.25% -2.29% 5.68% 28/2/20 -1.35% -10.26% -10.86% -5.13% 31/3/20 -31.30% -12.26% -18.58% 30/4/20 13.43% 19.66% 19,60% 15.11% Var Rp) Std Dev (Rp) 0.00414620292 x'Vx 6.44% AutoSave AIB 2 O... Tutorial 3 Home Insert Draw Page Layout Formulas Data Review View Tell me Share Comments Calibri (Body) X (G v P A v 11 Ev Ayo ab Wran Text v General Insert Insert Delete Format Paste B 1 - A = = = - - Merge & Centre Y Conditional Format Cell Formatting as Table Styles Sort & Filter Sensitvity Analyse Data Find & Select y E7 . fx C D E F G H H j K L M N N P 5 U w w X 2 Z BHP 0.03090 0.21618 APT 0 0.21415 0.06300 -0.05540 0 003297 1914 IM CIC0445 1012 -10/12 0.10072 0.2014 - H12 11.1999 11.ZIP 11.05 -13.10422 1 Dates 2 2017-07-21 3 2017-08-21 4 2017-09-29 5 2017-10-31 2017-11-111 7 2017.12.29 2016-01-11 9 10 2011! 11 2016-04-30 12 2013-05-31 12 2013-06-29 14 2013-07-31 15 2013-08-31 16 2018 00:20 17 2013-10-31 18 2013 11 10 19 2018 12 31 20 2019 01 31 21 2019 02 20 22 2019 63 29 22 2019-04-20 24 2017 05-11 25 2019-06-28 26 2012-07-31 27 2012-06-30 28 2019-04-10 29 2019-10-11 W 2019-11-24 1 2010-12-11 2 2H1.11 01.06290 0.03719 0.03115 -0.04141 0.04577 -0.06570 -0.04295 0.12001 0.02209 0.07271 0.03763 -0.02473 0.01366 00916 -0.00612 - - 0590 0101514 -101556 0.14556 0.5.658 0.27855 -0.0093 -0.30418 0.15452 0.14008 0.28306 0.15901 0.13613 0.22148 -0.03628 0.03810 0.001 0.15857 0.15754 -1 1951 1.09949 -0.01742 1.1.1 342020405-11 36 2000404.30 36 2020-05-29 37 2020-06-30 38 2020-07-31 3 39 2020-08-31 20 2020.00 10 21 2020 10 30 23 2020 11 30 23 2020 12 21 44 2021 01 29 45 2021 02 26 LI 10145 -1 144/ -0.13499 0.11035 11095 0.07345 00350 0.02842 0.03478 -0.05717 -0.047LB 0.13140 021363 0.02984 0 13139 0.51955 0.28644 0.12879 0.33411 0.12522 0.0878 0.0.737 0.24197 0.14491 0.1252 47 Tutorial 3 + | 90% % ATLAS ARTERIA ALUMINA NEWCREST MINING TRANSURBAN 1.45% 1.78% 1.91% 1.08% E(Rp) ATLAS ARTERIA Correlation ATLAS ARTERIA ALUMINA NEWCREST MINING TRANSURBAN 1.00000 0.46241 0.44574 0.69021 ALUMINA 0.46241 1.OXKIO 0.49127 0.39708 NEWCREST MINING TRANSURBAN 0.44574 0.66021 0.49127 0.39708 1.00000 0.51712 0.51717 100X100 Correlation ATLAS ARTERIA ALUMINA NEWCREST MINING TRANSURBAN ATLAS ARTERIA ALUMINA NEWCREST MINING TRANSURBAN 1 0.462409787 0.445741399 0.69021098 0.462409787 1 0.491274791 0.397075301 0.445741390 0.491274791 1 0.517167766 0.69021098 0.397075301 0.517167766 1 Covariance ATLAS ARTERIA ALUMINA NEWCREST MINING TRANSURBAN ATLAS ARTERIA ALUMINA NEWCREST MINING TRANSURBAN 0.00517 0.00292 0.00296 0.00254 0.00292 0.00772 0.00398 0.00178 0.00296 0.00398 0.00852 0.00244 0.00254 0.00178 0.00244 0.00261 Weights Sumweights) 100.0096 16.55% 31.749 34.32% 17.39% E(Rp) E(Rp) E(Rp) 1.6504 1.650% 1.650% Date ATLAS ARTERIA ALUMINA NEWCREST MINING TRANSURBAN 29/1/16 4.91% 9.84% -0.69% 3.32% 29/2/16 10.54% 30.69% 35.87% 5.63% 31/3/16 3.64% -2.77% -3.08% 0.35% 29/4/16 1.46% 15.61% 11.85% 2.35% 31/5/16 7.60% -4.84% 0.53% 4,38% 30/6/16 -1.14% -7.97% 20.61% -0.17% 29/7/16 12.35% 2.86% 8.70% 5.07% 31/8/16 -4,81% 0.92% - 11.229 -8.45% 30/9/16 -8.27% 10.20% 0.04% -0.44% 31/10/16 -5.41% 8.59% 1.70% -8.30% 30/11/16 -0.42% 3.09% -13.35% 1.83% 30/12/16 7.45% 10.91% 3.68% - 1.70% 31/1/17 -0.59% 6.32% 6.36% -0.78% 28/2/17 -2.39% -4.65% 2.88% 8.51% 31/3/17 6.54% -2.61% 0.65% 6.20 28/4/17 4.30% 3.14% 4.94% 4.87% 31/5/17 9.55% 4.75% -0.03% 1.35% 30/6/17 -4.10% 0.35% -4.58% -3,46% 31/7/17 -0.89% -0.72% 0.26% 31/8/17 2.16% 11.99% 13,20% 7.01% 29/9/17 -1.72% 4.13% -7.94% -1.94% 31/10/17 9.76% 6.73% 2.30% 30/11/17 2.52% -4.80% 4.09% 3.84% 29/12/17 2.95% 9.82% -2.03% -0.06% 31/1/18 -8.74% -0.49% -0.58% -2.90% 28/2/18 -3.48% -7.12% -6.21% -3.30% 30/3/18 4.33% 6.49% -7.896 -0.98% 30/4/18 13,66% 12.47% 8.21% 1.98% 31/5/18 3.42% 2.09% -1.77% 2.76% 29/6/18 -3.31% 5.01% 5.08% 1.23% 31/7/18 1.71% 1.59% -0.71% -1.86% 31/8/18 5.20% 2.37% -10.28% 3.52% 28/9/18 3.23% -3.18% 0.20% -5.13% 31/10/18 -2.15% -7.21% 6.30% 1.52% 30/11/18 -1.90% -11,81% 0.78% 0.86% 31/12/18 -6.57% 4.02% 5.16% 2.69% 31/1/19 6.23% 6.61% 12.26% 4.92% 28/2/19 7.07% 5.75% -0.45% 2.84% 29/3/19 3.56% % -4.15% 4.98% 6.25% 30/4/19 -3.05% -6.42% -1.88% 2.19% 31/5/19 1.14% 7.97% 8.89% 4.04% 28/6/19 10.73% -1.53% 17.50% 6.15% 31/7/19 4,46% 1.64% 11.44% 5.87 30/8/19 3.79% -6.20% 4.06% -3.53% 30/9/19 -6.47% 10,20% -6.01% -1.41% 31/10/19 2.95% -3.25% -9.85% 1.39% 29/11/19 -3.23% 2.66% 3.77% 31/12/19 2.35% 0.52% -1.57% -2.53% 31/1/20 3.83% -4.25% -2.29% 5.68% 28/2/20 -1.35% -10.26% -10.86% -5.13% 31/3/20 -31.30% -12.26% -18.58% 30/4/20 13.43% 19.66% 19,60% 15.11% Var Rp) Std Dev (Rp) 0.00414620292 x'Vx 6.44% AutoSave AIB 2 O... Tutorial 3 Home Insert Draw Page Layout Formulas Data Review View Tell me Share Comments Calibri (Body) X (G v P A v 11 Ev Ayo ab Wran Text v General Insert Insert Delete Format Paste B 1 - A = = = - - Merge & Centre Y Conditional Format Cell Formatting as Table Styles Sort & Filter Sensitvity Analyse Data Find & Select y E7 . fx C D E F G H H j K L M N N P 5 U w w X 2 Z BHP 0.03090 0.21618 APT 0 0.21415 0.06300 -0.05540 0 003297 1914 IM CIC0445 1012 -10/12 0.10072 0.2014 - H12 11.1999 11.ZIP 11.05 -13.10422 1 Dates 2 2017-07-21 3 2017-08-21 4 2017-09-29 5 2017-10-31 2017-11-111 7 2017.12.29 2016-01-11 9 10 2011! 11 2016-04-30 12 2013-05-31 12 2013-06-29 14 2013-07-31 15 2013-08-31 16 2018 00:20 17 2013-10-31 18 2013 11 10 19 2018 12 31 20 2019 01 31 21 2019 02 20 22 2019 63 29 22 2019-04-20 24 2017 05-11 25 2019-06-28 26 2012-07-31 27 2012-06-30 28 2019-04-10 29 2019-10-11 W 2019-11-24 1 2010-12-11 2 2H1.11 01.06290 0.03719 0.03115 -0.04141 0.04577 -0.06570 -0.04295 0.12001 0.02209 0.07271 0.03763 -0.02473 0.01366 00916 -0.00612 - - 0590 0101514 -101556 0.14556 0.5.658 0.27855 -0.0093 -0.30418 0.15452 0.14008 0.28306 0.15901 0.13613 0.22148 -0.03628 0.03810 0.001 0.15857 0.15754 -1 1951 1.09949 -0.01742 1.1.1 342020405-11 36 2000404.30 36 2020-05-29 37 2020-06-30 38 2020-07-31 3 39 2020-08-31 20 2020.00 10 21 2020 10 30 23 2020 11 30 23 2020 12 21 44 2021 01 29 45 2021 02 26 LI 10145 -1 144/ -0.13499 0.11035 11095 0.07345 00350 0.02842 0.03478 -0.05717 -0.047LB 0.13140 021363 0.02984 0 13139 0.51955 0.28644 0.12879 0.33411 0.12522 0.0878 0.0.737 0.24197 0.14491 0.1252 47 Tutorial 3 + | 90% %


