

Answered step by step
Verified Expert Solution
Question
1 Approved Answer
Select a cell to the right of the provided data on the Data and Solution tab, label the cell MH analysis and highlight it green,
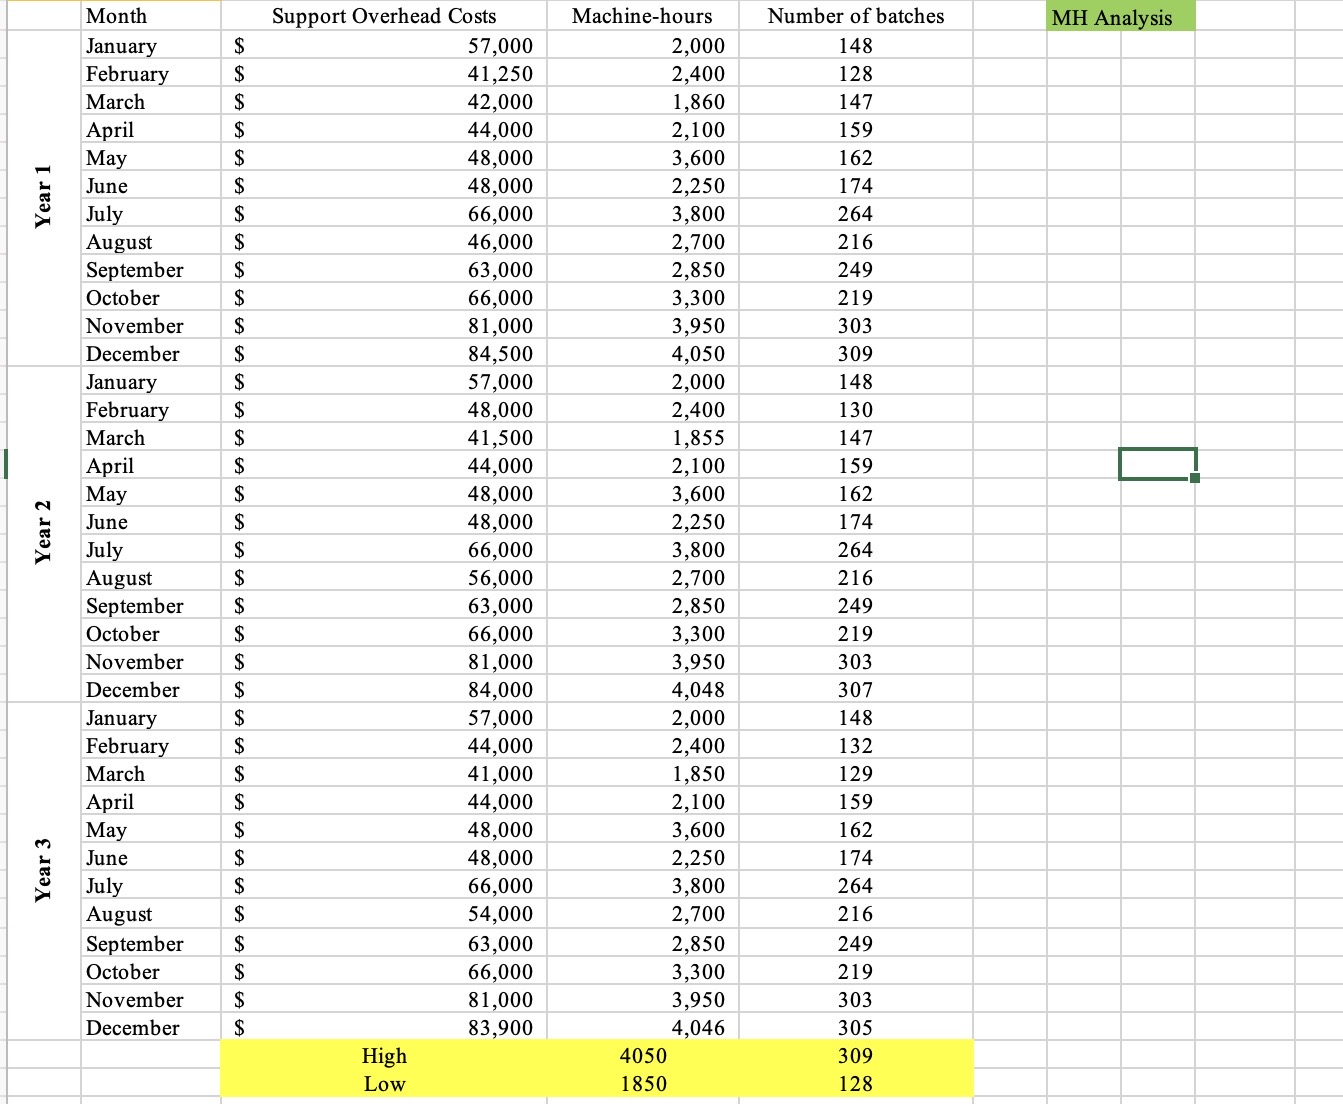 Select a cell to the right of the provided data on the Data and Solution tab, label the cell "MH analysis" and highlight it green, complete the "high/low" method near this cell and write out the cost formula using Machine-hours as the cost driverNear the cell you labeled "MH Analysis" complete the regression analysis using Machine-hours as the cost driver independent variable and Support Overhead Costs as the dependent variableOn the regression output, highlight the cells containing R-square value, the intercept, and slope variable 1 in greenInclude the scatterplot with trend line for the analysis you completed in step 11, change the color of the trend line to green, extend the trend line to the left 1000 units and to the right 1000 unitsSelect a cell to the right of the provided data and below the Machine-hours section your created, name the cell "Batches analysis", complete the "high/low" method and write out the cost formula using Number of batches as the cost driverNear the cell you labeled "Batches Analysis" Complete the regression analysis using Number of batches as the cost driver independent variable and Support Overhead Costs as the dependent variableOn the regression output, highlight the cells containing R-square value, the intercept, and slope variable 1 in blueInclude the scatterplot with trend line for the analysis you completed in step 15, change the color of the trend line to blue, extend the trend line to the left 1000 units and to the right 1000 units
Step by Step Solution
There are 3 Steps involved in it
Step: 1

Get Instant Access to Expert-Tailored Solutions
See step-by-step solutions with expert insights and AI powered tools for academic success
Step: 2

Step: 3
Ace Your Homework with AI
Get the answers you need in no time with our AI-driven, step-by-step assistance
Get Started
Financial Statement Analysis And Earnings Forecasting In Accounting
Authors: Steven J Monahan
1st Edition
1680834509, 978-1680834505