Select a Company, State the company and answer the questions. Please provide proof of statements or reference documents


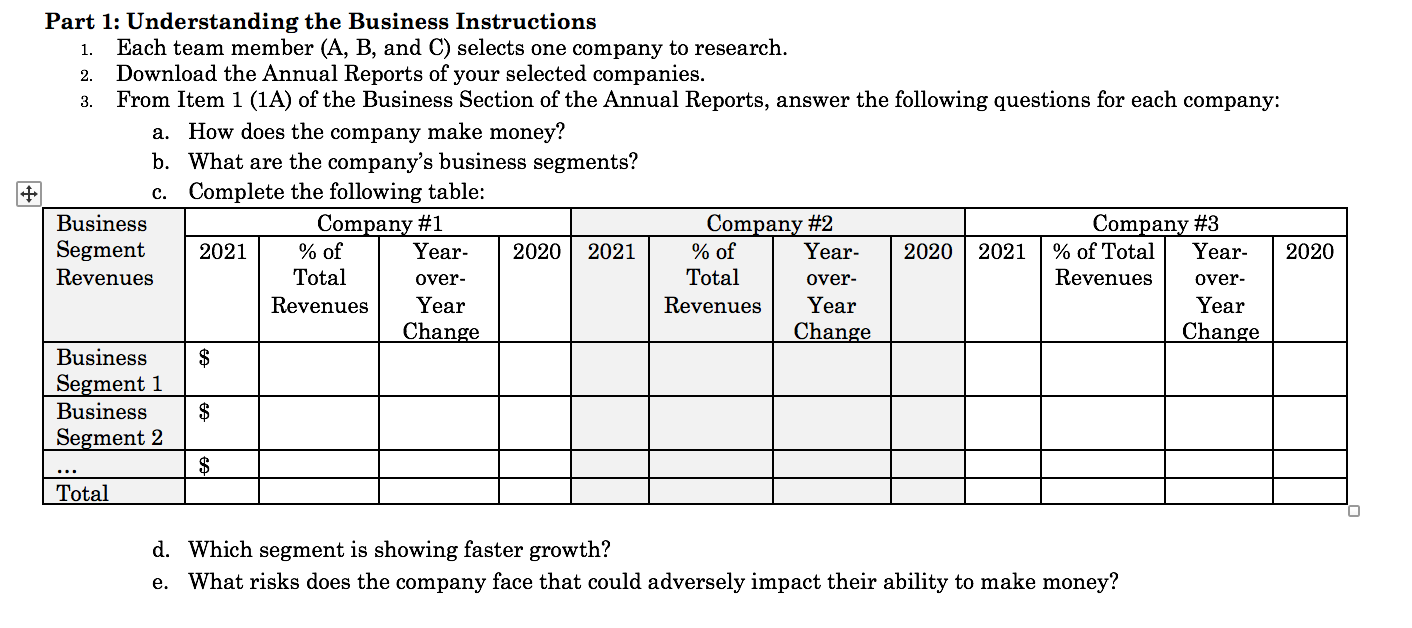
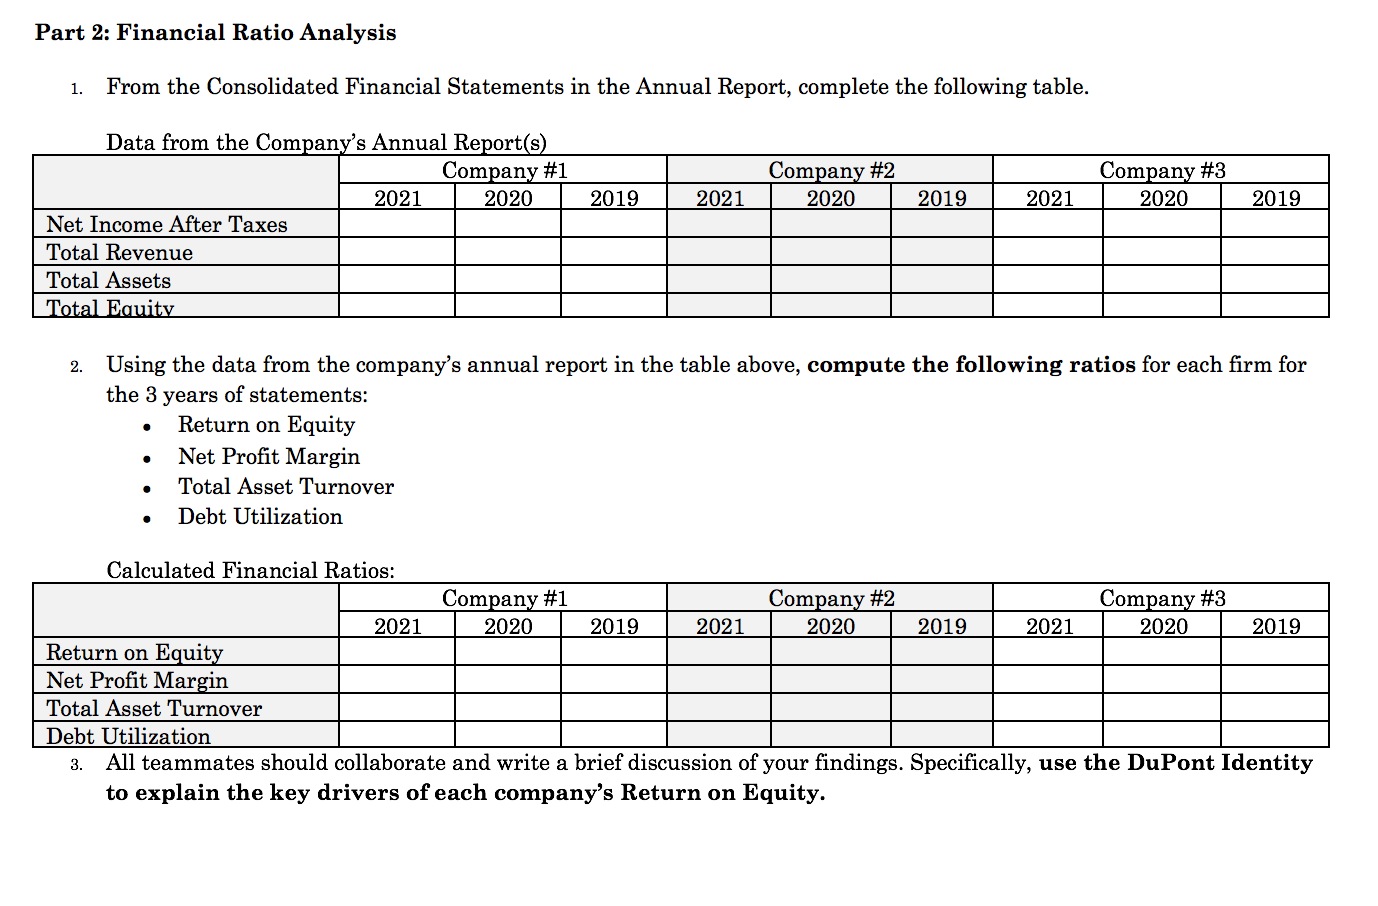
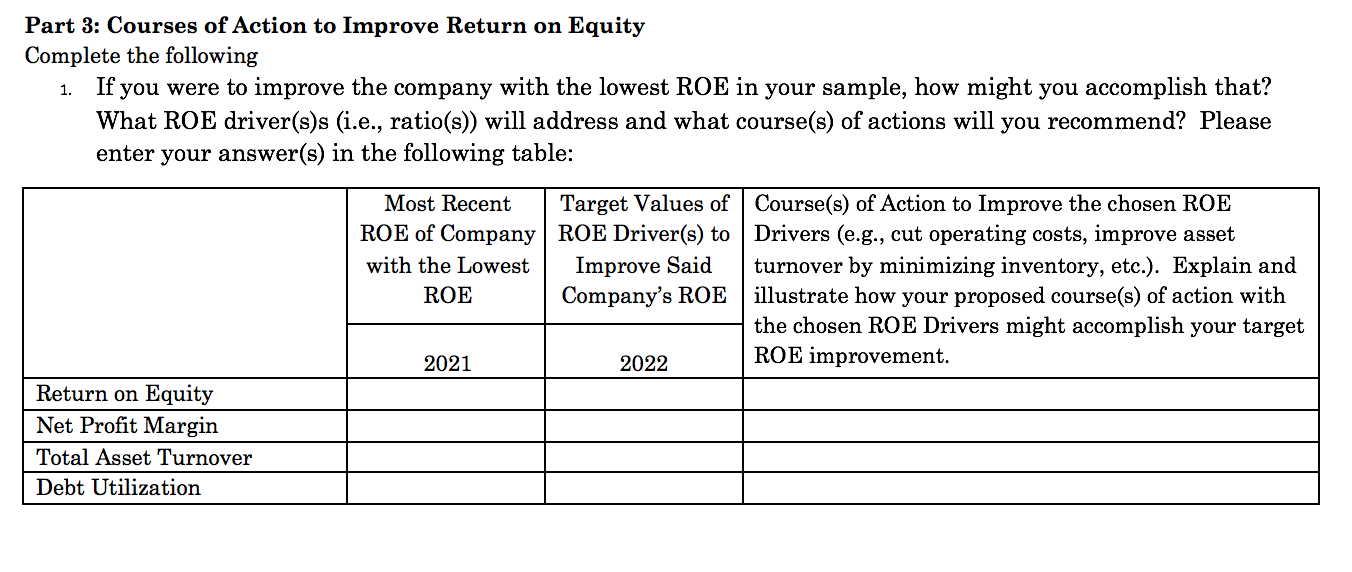
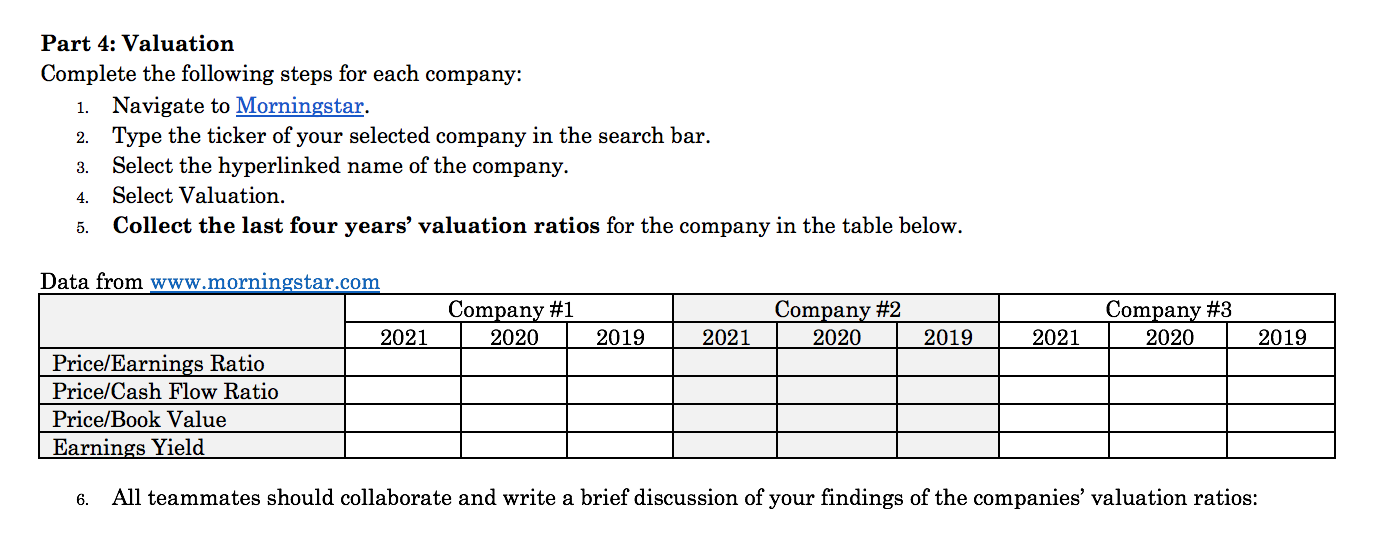
1. 2. 3. + Part 1: Understanding the Business Instructions Each team member (A, B, and C) selects one company to research. Download the Annual Reports of your selected companies. From Item 1 (1A) of the Business Section of the Annual Reports, answer the following questions for each company: a. How does the company make money? b. What are the company's business segments? C. Complete the following table: Business Company #1 Company #2 Company #3 Segment 2021 % of Year- 2020 2021 % of Year- 2020 2021 % of Total Year- 2020 Revenues Total Total Revenues Revenues Year Revenues Year Year Change Change Change Business $ Segment 1 Business $ Segment 2 $ Total over- over- Over- d. Which segment is showing faster growth? e. What risks does the company face that could adversely impact their ability to make money? Part 2: Financial Ratio Analysis 1. From the Consolidated Financial Statements in the Annual Report, complete the following table. Company #2 2020 Company #3 2020 2019 2021 2019 2021 2019 Data from the Company's Annual Report(s) Company #1 2021 2020 Net Income After Taxes Total Revenue Total Assets Total Equity 2. . Using the data from the company's annual report in the table above, compute the following ratios for each firm for the 3 years of statements: Return on Equity Net Profit Margin Total Asset Turnover Debt Utilization . . . Calculated Financial Ratios: Company #1 Company #2 Company #3 2021 2020 2019 2021 2020 2019 2021 2020 2019 Return on Equity Net Profit Margin Total Asset Turnover Debt Utilization 3. All teammates should collaborate and write a brief discussion of your findings. Specifically, use the DuPont Identity to explain the key drivers of each company's Return on Equity. Part 3: Courses of Action to Improve Return on Equity Complete the following If you were to improve the company with the lowest ROE in your sample, how might you accomplish that? What ROE driver(s)s (i.e., ratio(s)) will address and what course(s) of actions will you recommend? Please enter your answer(s) in the following table: 1. Most Recent Target Values of Course(s) of Action to Improve the chosen ROE ROE of Company | ROE Driver(s) to Drivers (e.g., cut operating costs, improve asset with the Lowest Improve Said turnover by minimizing inventory, etc.). Explain and ROE Company's ROE illustrate how your proposed course(s) of action with the chosen ROE Drivers might accomplish your target 2021 2022 ROE improvement. Return on Equity Net Profit Margin Total Asset Turnover Debt Utilization Part 4: Valuation Complete the following steps for each company: 1. Navigate to Morningstar. 2. Type the ticker of your selected company in the search bar. Select the hyperlinked name of the company. Select Valuation. Collect the last four years' valuation ratios for the company in the table below. 3. 4. 5. Data from www.morningstar.com Company #1 2020 Company #2 2020 Company #3 2020 2021 2019 2021 2019 2021 2019 Price/Earnings Ratio Price/Cash Flow Ratio Price/Book Value Earnings Yield 6. All teammates should collaborate and write a brief discussion of your findings of the companies' valuation ratios: 1. 2. 3. + Part 1: Understanding the Business Instructions Each team member (A, B, and C) selects one company to research. Download the Annual Reports of your selected companies. From Item 1 (1A) of the Business Section of the Annual Reports, answer the following questions for each company: a. How does the company make money? b. What are the company's business segments? C. Complete the following table: Business Company #1 Company #2 Company #3 Segment 2021 % of Year- 2020 2021 % of Year- 2020 2021 % of Total Year- 2020 Revenues Total Total Revenues Revenues Year Revenues Year Year Change Change Change Business $ Segment 1 Business $ Segment 2 $ Total over- over- Over- d. Which segment is showing faster growth? e. What risks does the company face that could adversely impact their ability to make money? Part 2: Financial Ratio Analysis 1. From the Consolidated Financial Statements in the Annual Report, complete the following table. Company #2 2020 Company #3 2020 2019 2021 2019 2021 2019 Data from the Company's Annual Report(s) Company #1 2021 2020 Net Income After Taxes Total Revenue Total Assets Total Equity 2. . Using the data from the company's annual report in the table above, compute the following ratios for each firm for the 3 years of statements: Return on Equity Net Profit Margin Total Asset Turnover Debt Utilization . . . Calculated Financial Ratios: Company #1 Company #2 Company #3 2021 2020 2019 2021 2020 2019 2021 2020 2019 Return on Equity Net Profit Margin Total Asset Turnover Debt Utilization 3. All teammates should collaborate and write a brief discussion of your findings. Specifically, use the DuPont Identity to explain the key drivers of each company's Return on Equity. Part 3: Courses of Action to Improve Return on Equity Complete the following If you were to improve the company with the lowest ROE in your sample, how might you accomplish that? What ROE driver(s)s (i.e., ratio(s)) will address and what course(s) of actions will you recommend? Please enter your answer(s) in the following table: 1. Most Recent Target Values of Course(s) of Action to Improve the chosen ROE ROE of Company | ROE Driver(s) to Drivers (e.g., cut operating costs, improve asset with the Lowest Improve Said turnover by minimizing inventory, etc.). Explain and ROE Company's ROE illustrate how your proposed course(s) of action with the chosen ROE Drivers might accomplish your target 2021 2022 ROE improvement. Return on Equity Net Profit Margin Total Asset Turnover Debt Utilization Part 4: Valuation Complete the following steps for each company: 1. Navigate to Morningstar. 2. Type the ticker of your selected company in the search bar. Select the hyperlinked name of the company. Select Valuation. Collect the last four years' valuation ratios for the company in the table below. 3. 4. 5. Data from www.morningstar.com Company #1 2020 Company #2 2020 Company #3 2020 2021 2019 2021 2019 2021 2019 Price/Earnings Ratio Price/Cash Flow Ratio Price/Book Value Earnings Yield 6. All teammates should collaborate and write a brief discussion of your findings of the companies' valuation ratios


