Answered step by step
Verified Expert Solution
Link Copied!

Question

1 Approved Answer

Select one: Consider the following set of quarterly sales data given in thousands of dollars. Quarter Year 1 Year 2 Year 3 Winter 1,870 2,200

Select one:
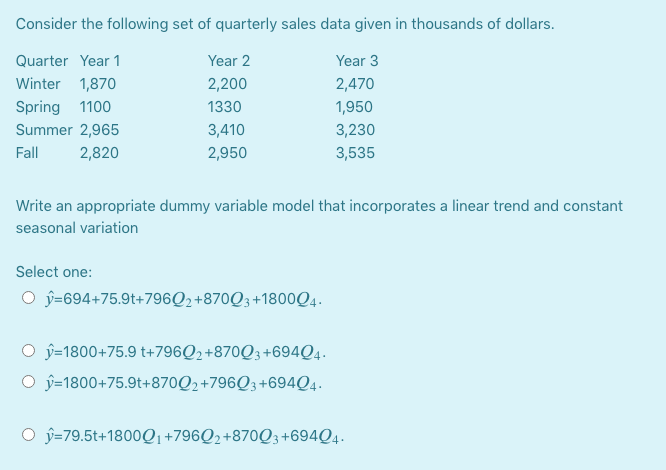
image text in transcribed
Consider the following set of quarterly sales data given in thousands of dollars. Quarter Year 1 Year 2 Year 3 Winter 1,870 2,200 2,470 Spring 1100 1330 1,950 Summer 2,965 3,410 3,230 Fall 2,820 2,950 3,535 Write an appropriate dummy variable model that incorporates a linear trend and constant seasonal variation Select one: O y=694+75.9t+796(2+870Q3+1800Q4. O j=1800+75.9 t+796(2+87003+69404. O j=1800+75.9t+870(2+79603+69404. O j=79.5t+1800@1+79602+87003+69404

Step by Step Solution

There are 3 Steps involved in it

Step: 1

blur-text-image

Get Instant Access to Expert-Tailored Solutions

See step-by-step solutions with expert insights and AI powered tools for academic success

Step: 2

blur-text-image_2

Step: 3

blur-text-image_3

Ace Your Homework with AI

Get the answers you need in no time with our AI-driven, step-by-step assistance

Get Started

Recommended Textbook for

Transportation A Global Supply Chain Perspective

Authors: John J. Coyle, Robert A. Novak, Brian Gibson, Edward J. Bard

8th edition

9781305445352, 1133592961, 130544535X, 978-1133592969

More Books

Students also viewed these Mathematics questions

Question

=+4 How can companies more accurately measure and forecast demand?

Answered: 1 week ago