Question
SELECTED BANK WESTPAC AUSTRALIA HERE IS THE CURRENT REPORT PLEASE ANSWER THESE 2 QUESTIONS ONLY . PLEASE BASE OF THIS REPORT WRITTEN BELOW ABOUT WESTPAC
SELECTED BANK WESTPAC AUSTRALIA
HERE IS THE CURRENT REPORT PLEASE ANSWER THESE 2 QUESTIONS ONLY . PLEASE BASE OF THIS REPORT WRITTEN BELOW ABOUT WESTPAC THE LAST 5 YEARS IN AUSTRALIA
1 . Analyse the book and market value of equity of your bank over the last five years and compare the difference between the two.
2. Conclude. Summarise your results in this section and comment on the overall position of the bank. For instance: Do you think the bank is well positioned to maintain competitive in the future? Why? Discuss. Can you identify potential weaknesses in the banks business lines (assets or liabilities)
| 2018 | 2019 | 2020 | 2021 | 2022 | |
| assets | 879592 | 906626 | 911946 | 935877 | 1014198 |
| liabilities | 815019 | 841119 | 843872 | 863785 | 943689 |
| equity | 64573 | 65507 | 68074 | 72092 | 70509 |
There has been a 3% increase in total assets from 2018 to 2019. This was mainly due to the $20.9 billion increase in trading securities and financial assets, $5.1 (1%) billion increase in loans and a 24% spike in collateral paid due to an increase in collateralised derivative liabilities. Derivative assets also grew by 24%; that was caused by movements in cross currency swaps, foreign currency forward contracts and interest rate swaps. The Group, however, saw a $6.7 billion (25%) decline in cash and balances with central banks. Totalling at $841 billion, liabilities were 3% larger than 2018. The most significant fluctuations included a growth of $1.1 billion (51%) in collateral received due to an increase in collateralised derivative assets and a $4.0 billion (1%) increase in deposits and other borrowings. Derivative liabilities also increased by $4.7 billion (19%) for the aforementioned reasoning of swap movements.
The next comparative period from 2019 to 2020 saw yet another positive incline of a $922.9 billion (1%) increase in total assets, that of which is a 50% increase from $20,059 to $30,129 million in the cash and balances with central banks component.
| 2018 | 2019 | 2020 | 2021 | 2022 | |
| ROA (net income/total assets) | 0.01 | 0.01 | 0.00 | 0.01 | 0.01 |
| Leverage (A/E) | 13.62 | 13.84 | 13.40 | 12.98 | 14.38 |
| Asset Utilisation | 0.04 | 0.04 | 0.03 | 0.03 | 0.03 |
The careful methodology that will be used to analyse Westpacs performance will be the following metrics: return on asset (ROA), leverage and asset utilisation.
- B. Analyse the profitability of your bank over the last five years by reporting the overall evolution in income (dollar numbers) as well as using ratio analysis, with a focus on the latter. (4 marks)

Net income is down drastically from 2018 to 2022. This can be seen in the net income change over the years. From 2018 to 2019 there was a decrease in net income of $1.311 billion, this is a 16.20% decrease in net income and the trend continued to go down as 2019 to 2020 there was a drastic drop with a decrease of $4.494 billion showing a 66.24% decrease in net income. There was an extreme spike for 2020 to 2021 with there being a $3.168 billion increase in net income representing a 138.34% increase in net income and then another increase from 2021 to 2022 of $236 million being a 4.32% increase. The severe spikes can be attributed to the COVID pandemic as all banks took hits to the income that they were able to bring in due to a multitude of factors such as needing to right off loses from customers not being able to pay back loans as they had lost jobs, hardship assistance needing to be taken into account and applied for a large measure of customers the bank had. This can be seen in how Westpac had roughly around 175,000 mortgage deferral packages that it had given to customers, along with roughly another 40,000 deferrals for businesses. While this was a leading factor of the sharp decline in the groups net income for 2020, another factor that really impacted and hampered the efforts of the Westpac group to stay more profitable were the findings of AUSTRAC and the $1.3 billion fine that they received and agreed to pay for serious breaches to the Anti-Money Laundering and Counter-Terrorism Financing Act 2006 (AML/CTF Act). While there was a sharp increase from 2020 to 2021 it must still be viewed that the trend was still down from the starting period as net income levels were still lower than pre-pandemic years of 2018 and 2019.
Section 2 (2 marks) Analyse the book and market value of equity of your bank over the last five years and compare the difference between the two.
| Figure 3.1 - Capital Adequacy Ratio | Figure 3.2 - Percentage growth of total capital (tier 1 and 2) and RWA components |
The significant increase in total tier 1 and tier 2 capital is shaped by Westpacs overarching capital management framework guided by the Internal Capital Adequacy Assessment Process, which has backed decisions across the 2018-22 period. The process addresses numerous factors relating to capital management, including stress testing for different scenarios, objective targets for capital, and external and internal stakeholder perspective considerations (Westpac, 2018; Westpac, 2022). For instance, in 2020, Westpac maintained a strong balance sheet position and high capital efficiency through the decision to focus on capital raising than dividend payout as guided by the framework which noted that the bank should retain their earnings to help offset capital reductions (Westpac, 2020).
Additionally, CAR has been directly affected by several APRA announcements, such as the 2019 announcement where APRA mandated an increase in operational risk capital overlays which has continued to have an impact through to 2022 through an increase in RWA and the decrease of level 2 common equity tier 1 capital (Westpac, 2019). The impact of this APRA mandate is seen in the 12% jump of RWA from 2019 to 2022 from $425384m to $477620m. Other 2019-21 announcements pertain to changes in risk weighting of specific tier 1 and tier 2 capital elements that affect the CAR calculation and general increases in total capital requirements and loss-absorbing capacity, such as 4.5% of RWA by 2026 (Westpac, 2022). APRA has also accommodated the evolving Covid-19 situation during its onset between 2020-21 through expectation adjustments and deferral of RWA calculations (Westpac, 2020; Westpac, 2021).
Tier 1 Capital Ratio
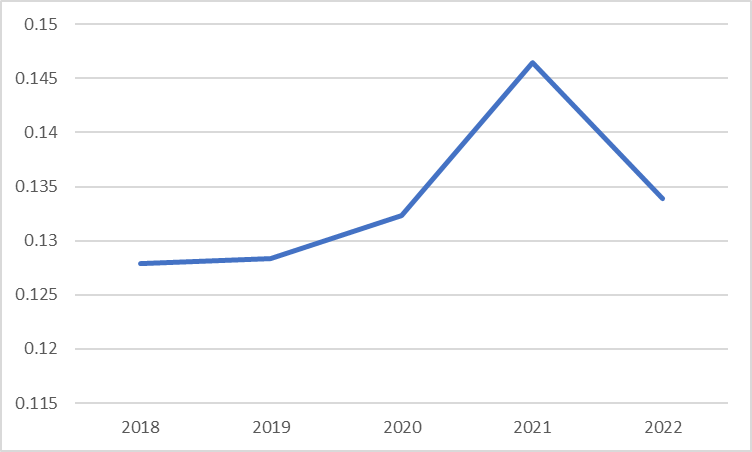
Westpac has sustained a high tier 1 capital ratio across 2018 to 2022, averaging at 13.38% and converging closely to a median of 13.23%, with only 1% changes on average. This level has resulted from increasing tier 1 capital over RWA with 5-year averages of 4% compared to 3%, with overall increases in Tier 1 Capital Ratio signified in figure 3.3. The ratio bares great significance due to its impact on shareholders by acting as an equity indicator for Westpacs capital distribution and net income generation capacity. In light of this, Westpac has maintained a favourable position for shareholders well above the APRA minimum of 6%, reflecting lower capital risk and strong equity buffers (Westpac, 2022).
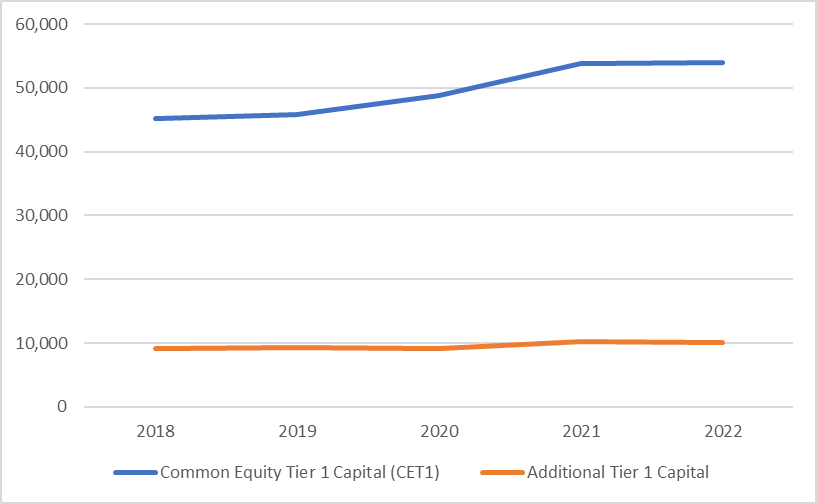
While increasing RWA has been the result of APRA announcements as mentioned in the CAR ratio discussion, strong tier 1 capital growth is primarily linked to positive 5-year growth (2018-22) in common equity tier 1 capital at 5%, backed by additional tier 1 capital growth at 2%. This is also highlighted in Figure 3.3, which shows that the increasing trend in CET1 is faster than additional tier 1 capital, as evidenced in the slopes of each curve.
| Figure 3.3 - Tier 1 Capital Ratio | Figure 3.4 - Common Equity Tier 1 Capital (CET1) and Additional Tier 1 Capital |
 |  |
Each year, Westpac has made numerous commitments to focus on the issuance of either common equity or additional tier capital to increase the net impact on the tier 1 capital where examples of notable events include:
Section 4 - Liquidity Risk
Liquidity Coverage Ratio (LCR)
Westpac has maintained a relatively strong liquidity coverage capacity indicated by its over 100% liquidity coverage ratio (LCR) from 2018 to 2022. This is indicated by the 5-year LCR average of 135%, with slight fluctuations averaging around 2% that converge around a median of 132%.
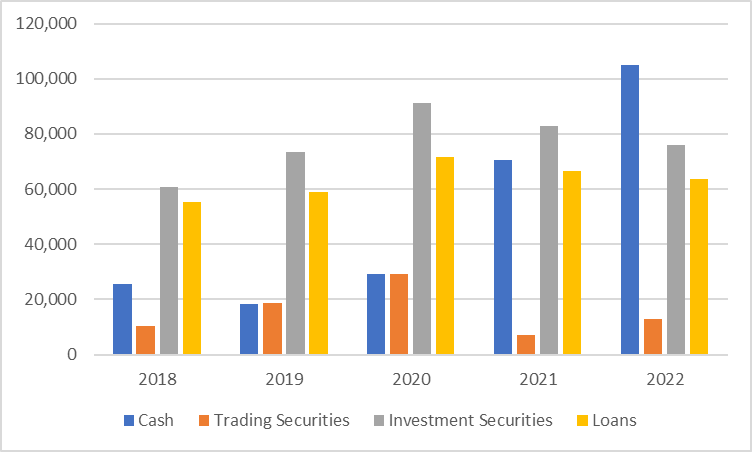
Westpac continues to increase its holdings of HQLA indicated by a 9% growth across the 5-year period, where HQLA has jumped from $134b in 2018 to $191b in 2022. The increased growth in HQLA relative to total net cash outflow is demonstrated in Figure 4.1, where HQLA has sustained its increasingly positive position over the five years. While this increase in HQLA is hindered by increases in net cash outflow, averaging 9% from 2018-22, Westpac attempts to minimise outflows from its liabilities through careful selection and constant monitoring of the wholesale funding portfolios maturity and customer deposit base targets (Westpac, 2018; Westpac, 2019; Westpac, 2022). The sustained increase in HQLA can be attributed to Westpacs consistent implementation of strong funding and liquidity risk management frameworks that requires it to undertake measures including active management and stress buffer testing, annual funding reviews for its balance sheet and liquidity risk reports, as well as funding scenario planning (Westpac, 2018; Westpac, 2022). This has supported sustained increases in Westpacs HQLA portfolio across assets, including cash, trading securities, investment securities, and loans, evidenced in their increasing positive growth from 2018-22 ranging between 4% to 55% and increased holdings of cash and investment securities supported by stable holdings of loans and declining trading securities in figure 4.2.
| Figure 4.1 - Stock of HQLA and Total Net Cash Outflow | Figure 4.2 - Liquid Asset Portfolio |
 |
Net Stable Funding Ratio (NSFR)
| Figure 4.4 - 5-Year Average Composition of Available Stable Funding Items (ASF) | Figure 5.5 - 5-Year Average Composition of Required Stable Funding (RSF) |
Performance comparison
Risk comparison
\begin{tabular}{|l|r|r|r|r|r|} \hline WBC & 2018 & 2019 & 2020 & 2021 & 2022 \\ \hline Net Income & 8095 & 6784 & 2290 & 5458 & 5694 \\ \hline Net Interest Income & 16505 & 16907 & 16696 & 16858 & 17161 \\ \hline Net Non Interest Income & 5628 & 3742 & 3487 & 4364 & 2445 \\ \hline ROE & 12.54% & 10.36% & 3.36% & 7.49% & 8.08% \\ \hline Equity Multiplier & 13.62 & 13.84 & 13.40 & 12.84 & 14.38 \\ \hline Net Profit Margin & 36.57% & 32.85% & 11.35% & 25.72% & 29.04% \\ \hline Net Interest Margin & 1.91% & 1.89% & 1.84% & 1.82% & 1.76% \\ \hline \end{tabular} 0.15 60,000 50,000 40,000 30,000 20,000 10,000 0 \begin{tabular}{lllll} \hline 2018 & 2019 & 2020 & 2021 & 2022 \end{tabular} Common Equity Tier 1 Capital (CET1) Additional Tier 1 Capital
Step by Step Solution
There are 3 Steps involved in it
Step: 1

Get Instant Access to Expert-Tailored Solutions
See step-by-step solutions with expert insights and AI powered tools for academic success
Step: 2

Step: 3

Ace Your Homework with AI
Get the answers you need in no time with our AI-driven, step-by-step assistance
Get Started


