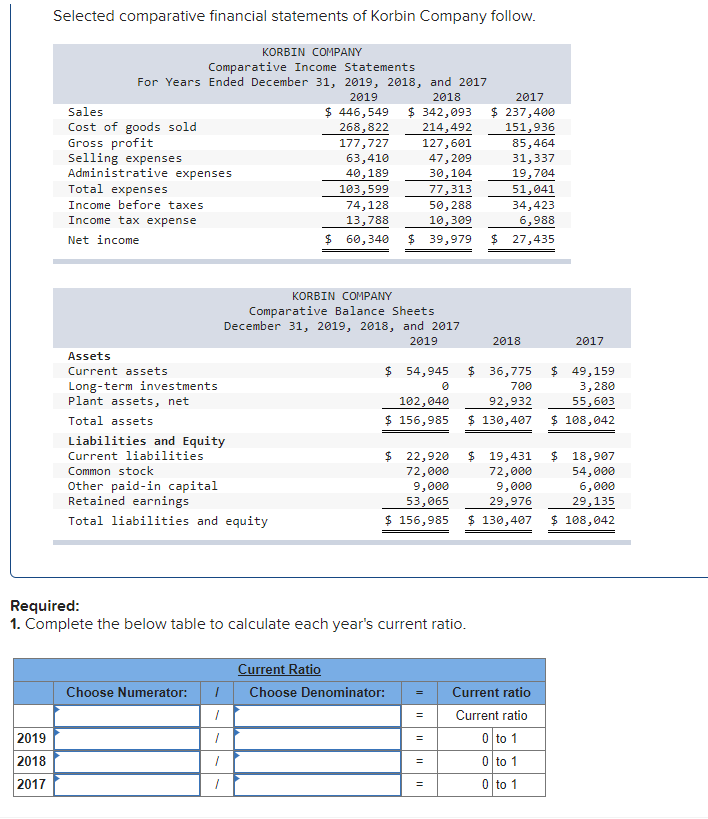
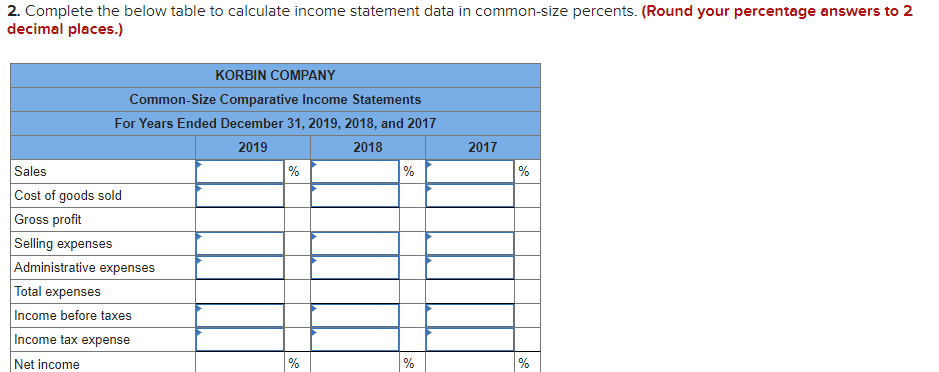
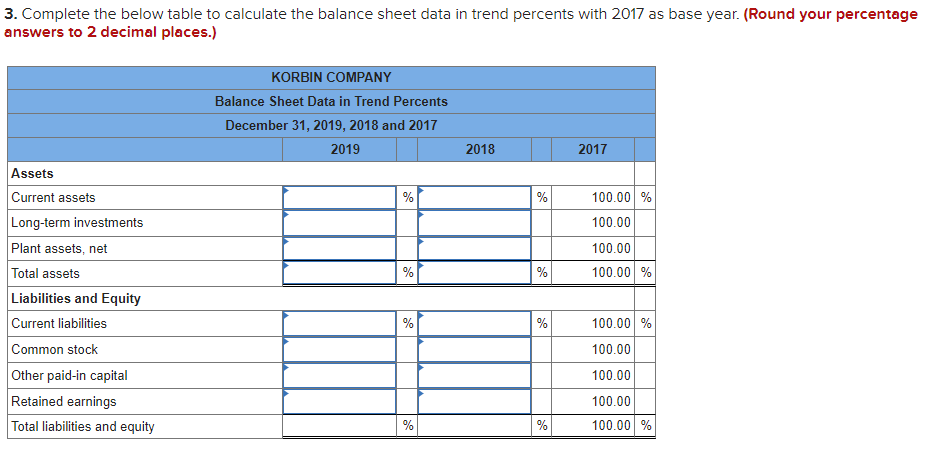
Selected comparative financial statements of Korbin Company follow. KORBIN COMPANY Comparative Income Statements For Years Ended December 31, 2019, 2018, and 2017 2019 2018 2017 Sales $ 446,549 $ 342,093 $ 237,400 Cost of goods sold 268,822 214,492 151,936 Gross profit 177,727 127,601 85,464 Selling expenses 63,410 47,209 31,337 Administrative expenses 40, 189 30,104 19,704 Total expenses 103,599 77,313 51,041 Income before taxes 74,128 50,288 34,423 Income tax expense 13,788 10,309 6,988 Net income $ 60,340 $ 39,979 $ 27,435 2017 KORBIN COMPANY Comparative Balance Sheets December 31, 2019, 2018, and 2017 2019 2018 Assets Current assets $ 54,945 $ 36,775 Long-term investments 700 Plant assets, net 102,040 92,932 Total assets $ 156,985 $ 130,407 Liabilities and Equity Current liabilities $ 22,920 $ 19,431 Common stock 72,000 72,000 Other paid-in capital 9,000 9,000 Retained earnings 53,065 29,976 Total liabilities and equity $ 156,985 $ 130,407 $ 49, 159 3,280 55,603 $ 108,042 $ 18,907 54,000 6,000 29,135 $ 108,042 Required: 1. Complete the below table to calculate each year's current ratio. Current Ratio Choose Denominator: Choose Numerator: 1 1 1 2019 2018 2017 Current ratio Current ratio 0 to 1 0 to 1 0 to 1 2. Complete the below table to calculate income statement data in common-size percents. (Round your percentage answers to 2 decimal places.) 2017 KORBIN COMPANY Common-Size Comparative Income Statements For Years Ended December 31, 2019, 2018, and 2017 2019 2018 Sales % % Cost of goods sold Gross profit Selling expenses Administrative expenses Total expenses Income before taxes Income tax expense Net income % % % 3. Complete the below table to calculate the balance sheet data in trend percents with 2017 as base year. (Round your percentage answers to 2 decimal places.) KORBIN COMPANY Balance Sheet Data in Trend Percents December 31, 2019, 2018 and 2017 2019 2018 2017 % % 100.00 % 100.00 100.00 100.00 % % % Assets Current assets Long-term investments Plant assets, net Total assets Liabilities and Equity Current liabilities Common stock Other paid-in capital Retained earnings Total liabilities and equity % % 100.00 % 100.00 100.00 100.00 % % 100.00 %