Answered step by step
Verified Expert Solution
Question
1 Approved Answer
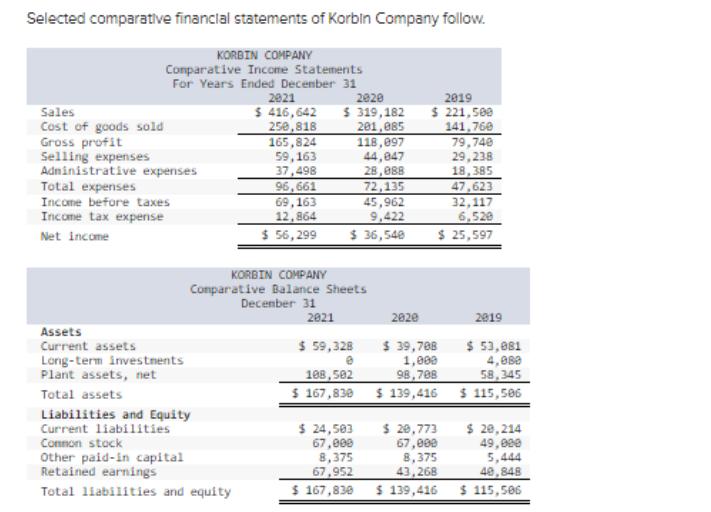
Selected comparative financial statements of Korbin Company follow. KORBIN COMPANY Comparative Income Statements For Years Ended December 31 2021 $ 416,642 250,818 Sales Cost


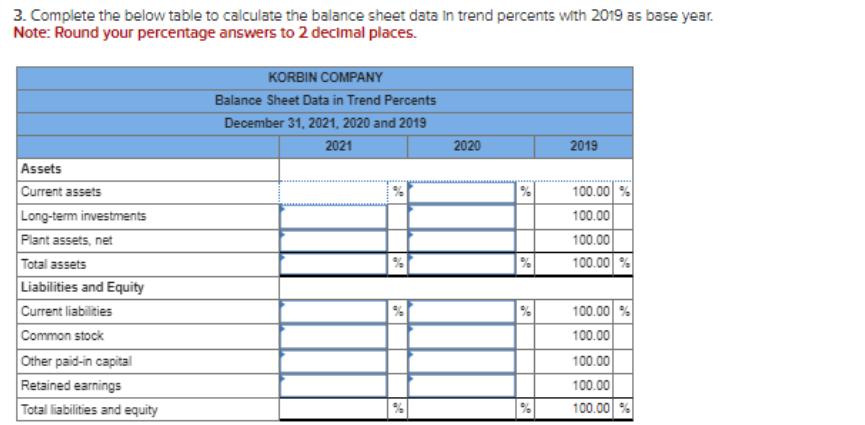
Selected comparative financial statements of Korbin Company follow. KORBIN COMPANY Comparative Income Statements For Years Ended December 31 2021 $ 416,642 250,818 Sales Cost of goods sold Gross profit Selling expenses Administrative expenses Total expenses Income before taxes Income tax expense Net Income Assets Current assets Long-term investments Plant assets, net Total assets 165,824 59,163 37,498 Liabilities and Equity Current liabilities Common stock Other paid-in capital Retained earnings Total liabilities and equity 2020 $319,182 201,085 118,097 44,047 28,088 96,661 69,163 12,864 $ 56,299 $ 36,540 KORBIN COMPANY Comparative Balance Sheets December 31 2021 72,135 45,962 9,422 $ 59,328 e $ 24,503 67,000 8,375 67,952 $ 167,830 2020 2019 $ 221,500 141,760 79,740 29,238 18,385 47,623 32,117 6,520 $ 25,597 108,502 $ 167,830 $ 139,416 $ 39,708 $ 53,081 1,000 4,080 98,708 58,345 $ 115,506 2019 $ 20,773 67,000 8,375 43,268 $ 139,416 $ 20,214 49,000 5,444 40,848 $ 115,506 3. Complete the below table to calculate the balance sheet data in trend percents with 2019 as base year. Note: Round your percentage answers to 2 decimal places. Assets Current assets Long-term investments Plant assets, net Total assets Liabilities and Equity Current liabilities Common stock Other paid-in capital Retained earnings Total liabilities and equity KORBIN COMPANY Balance Sheet Data in Trend Percents December 31, 2021, 2020 and 2019 2021 2020 % 20 2019 100.00 % 100.00 100.00 100.00 % 100.00 % 100.00 100.00 100.00 100.00 %
Step by Step Solution
★★★★★
3.40 Rating (150 Votes )
There are 3 Steps involved in it
Step: 1
To calculate the trend percentages you will use the 2019 figures as the base 100 and express the figures from 2020 and 2021 as a percentage of the 201...
Get Instant Access to Expert-Tailored Solutions
See step-by-step solutions with expert insights and AI powered tools for academic success
Step: 2

Step: 3

Ace Your Homework with AI
Get the answers you need in no time with our AI-driven, step-by-step assistance
Get Started


