Answered step by step
Verified Expert Solution
Question
1 Approved Answer
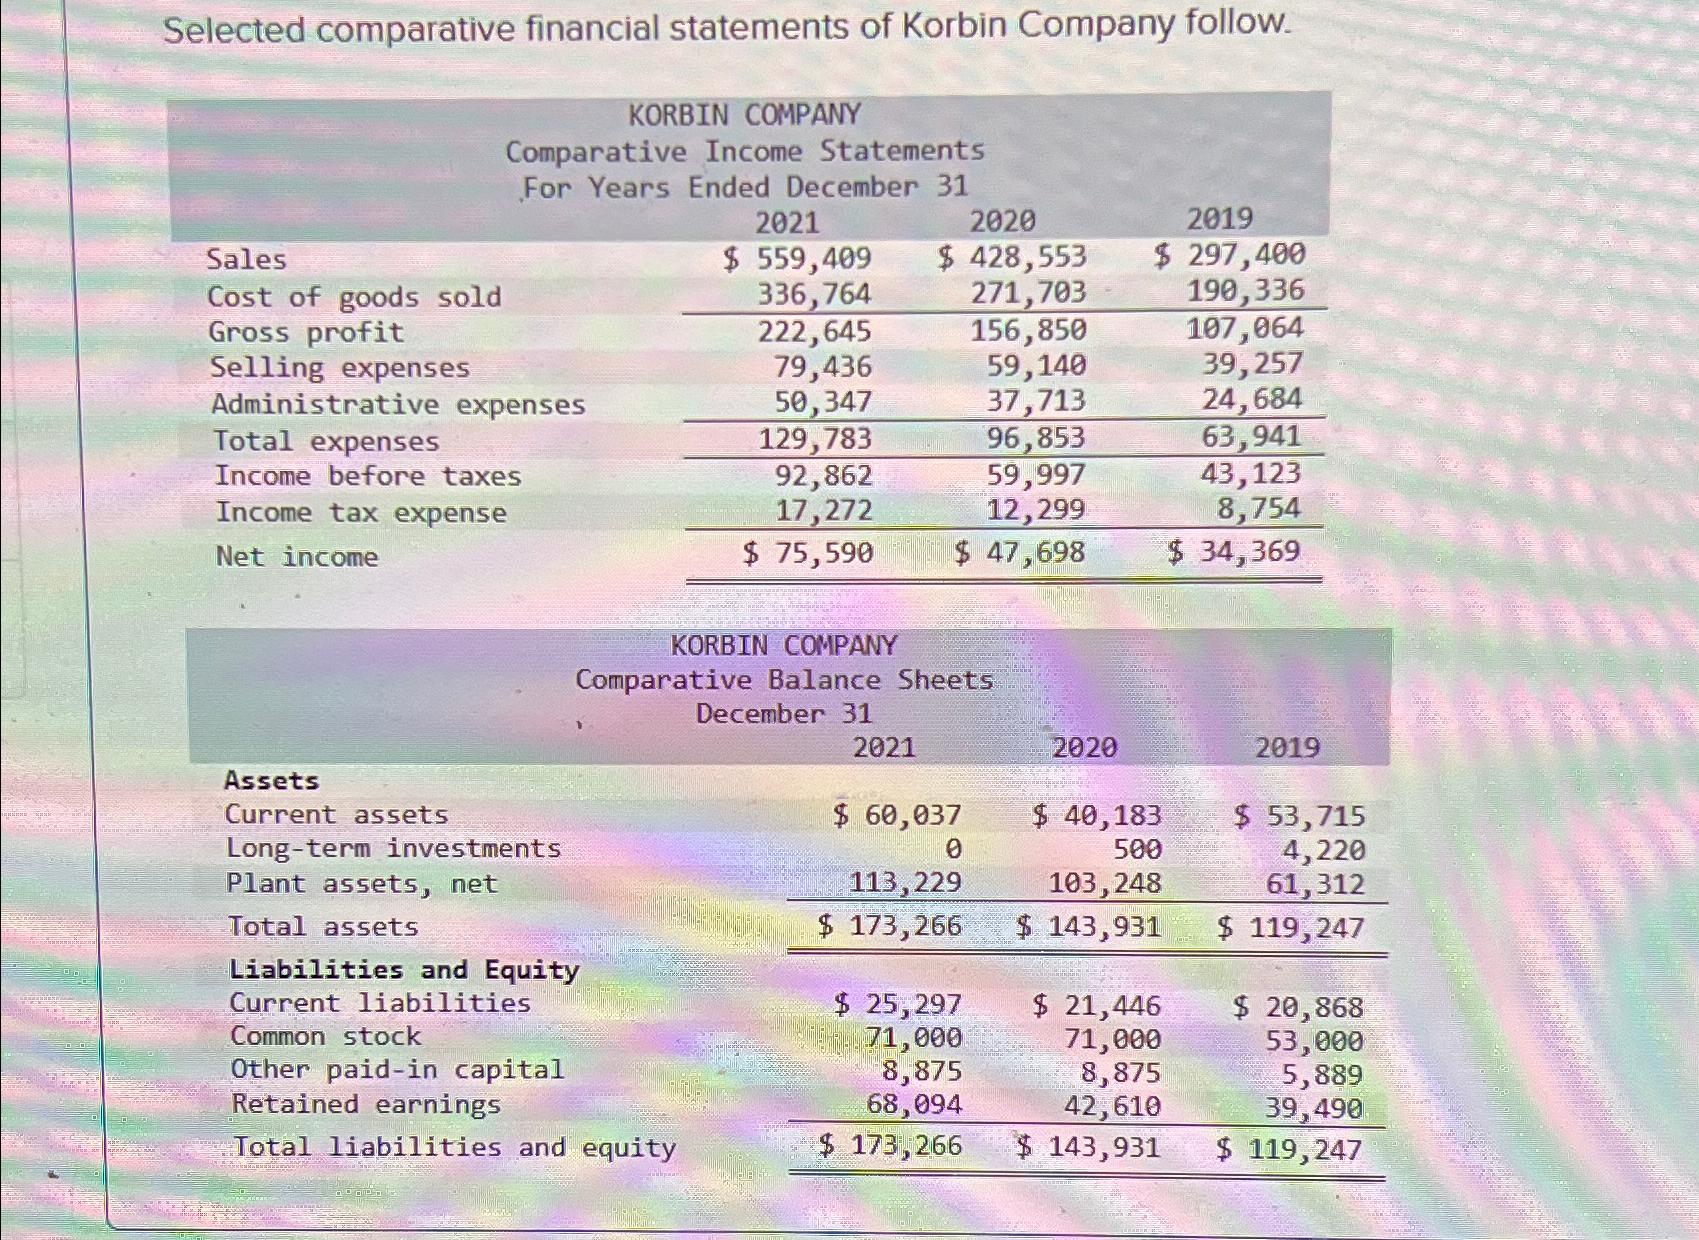
Selected comparative financial statements of Korbin Company follow. KORBIN COMPANY Comparative Income Statements For Years Ended December 31 Sales 2021 $ 559,409 2020 2019

Selected comparative financial statements of Korbin Company follow. KORBIN COMPANY Comparative Income Statements For Years Ended December 31 Sales 2021 $ 559,409 2020 2019 $ 428,553 $ 297,400 Cost of goods sold 336,764 271,703 190,336 Gross profit 222,645 156,850 107,064 Selling expenses 79,436 59,140 39,257 Administrative expenses 50,347 37,713 24,684 Total expenses 129,783 96,853 63,941 Income before taxes 92,862 59,997 43,123 Income tax expense 17,272 12,299 8,754 Net income $ 75,590 $ 47,698 $ 34,369 KORBIN COMPANY Comparative Balance Sheets December 31 Assets Current assets Long-term investments 2021 $ 60,037 0 Plant assets, net 113,229 Total assets $ 173,266 $ 143,931 Liabilities and Equity Current liabilities Common stock Other paid-in capital Retained earnings $ 25,297 71,000 8,875 68,094 Total liabilities and equity $ 173,266 2020 $ 40,183 500 103,248 $ 21,446 71,000 8,875 42,610 $ 143,931 2019 $ 53,715 4,220 61,312 $ 119,247 $ 20,868 53,000 5,889 39,490 $ 119,247
Step by Step Solution
There are 3 Steps involved in it
Step: 1
To analyze the given financial statements we can compare the figures across different years and cate...
Get Instant Access to Expert-Tailored Solutions
See step-by-step solutions with expert insights and AI powered tools for academic success
Step: 2

Step: 3

Ace Your Homework with AI
Get the answers you need in no time with our AI-driven, step-by-step assistance
Get Started


