Answered step by step
Verified Expert Solution
Question
1 Approved Answer
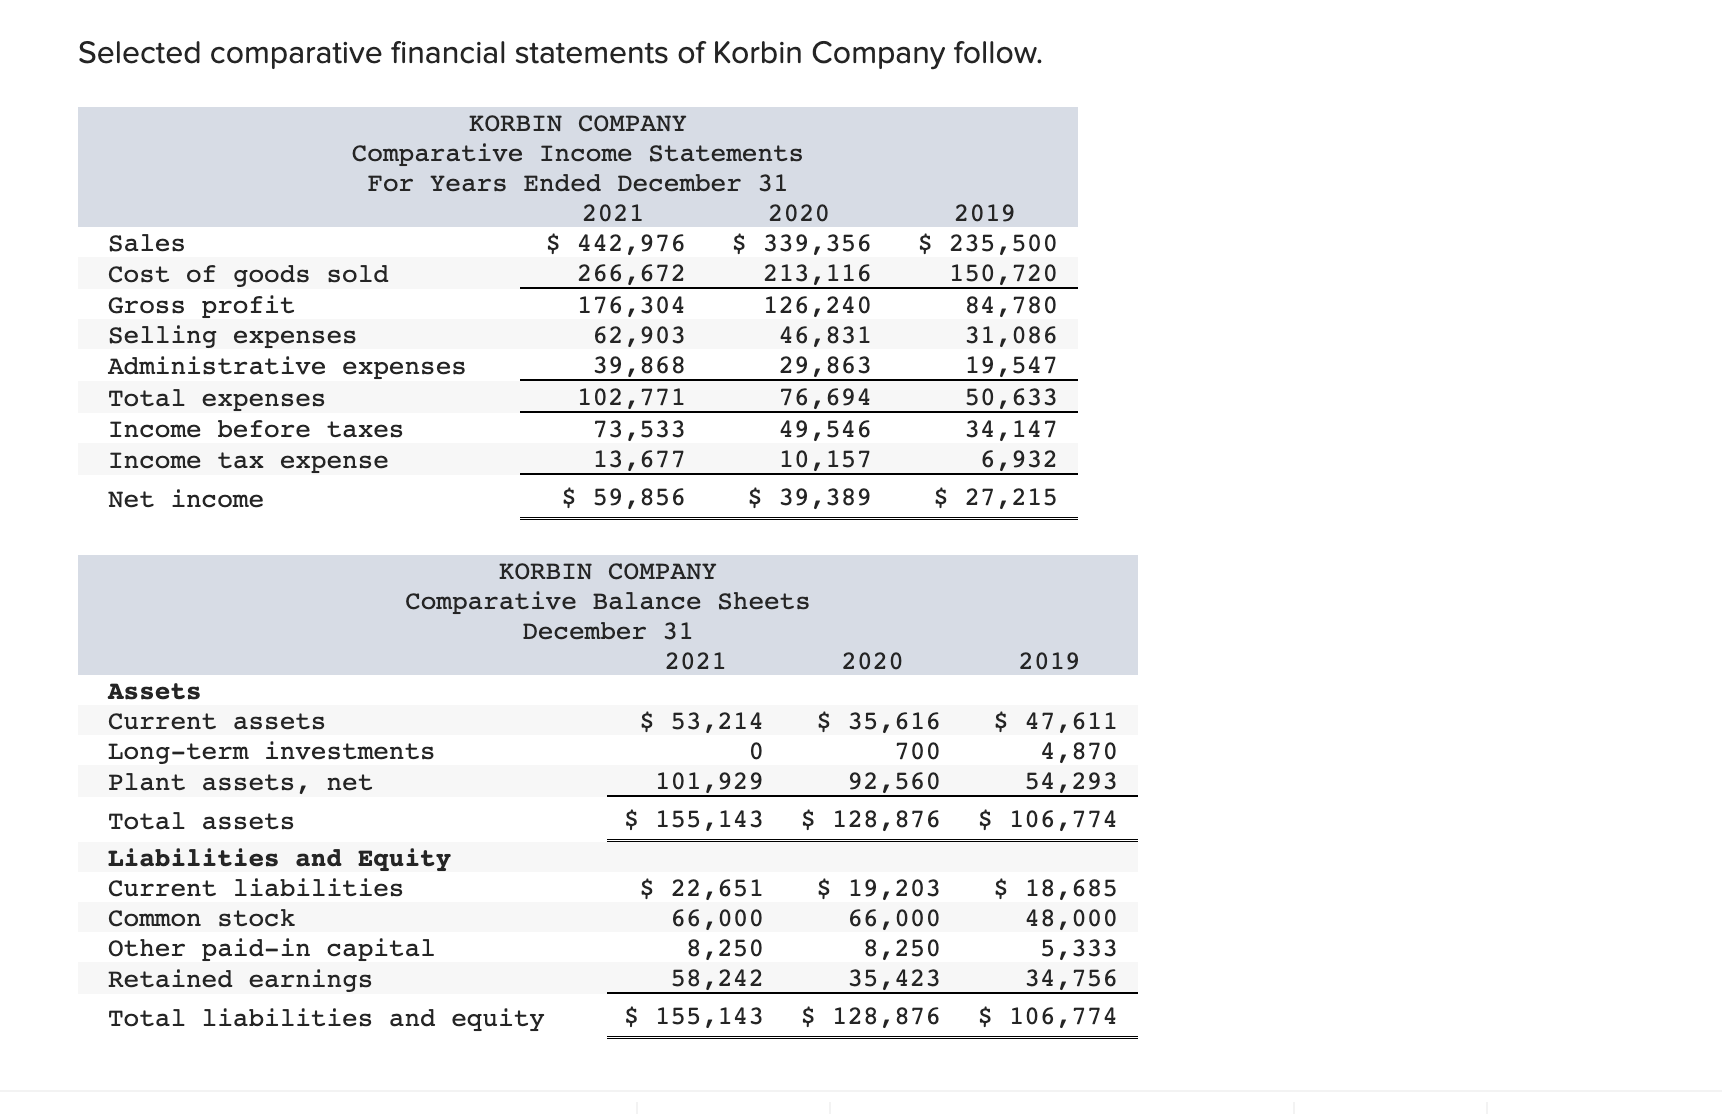
Selected comparative financial statements of Korbin Company follow. KORBIN COMPANY Comparative Income Statements For Years Ended December 31 2021 2020 $ 442,976 $ 339,356


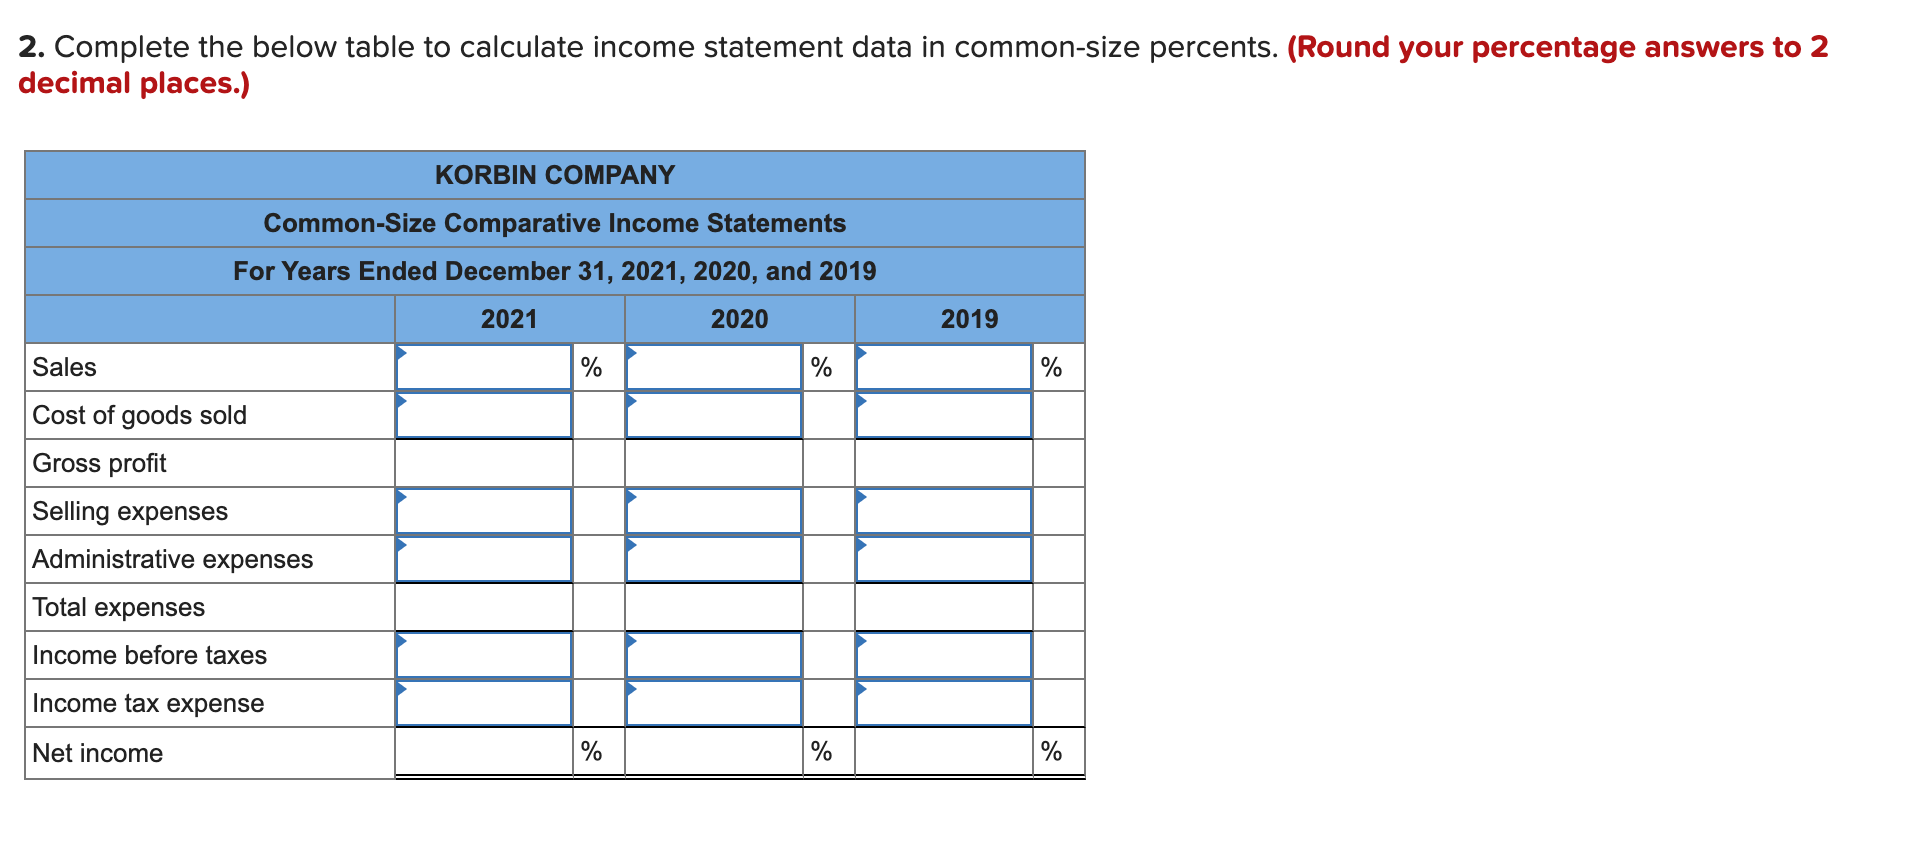
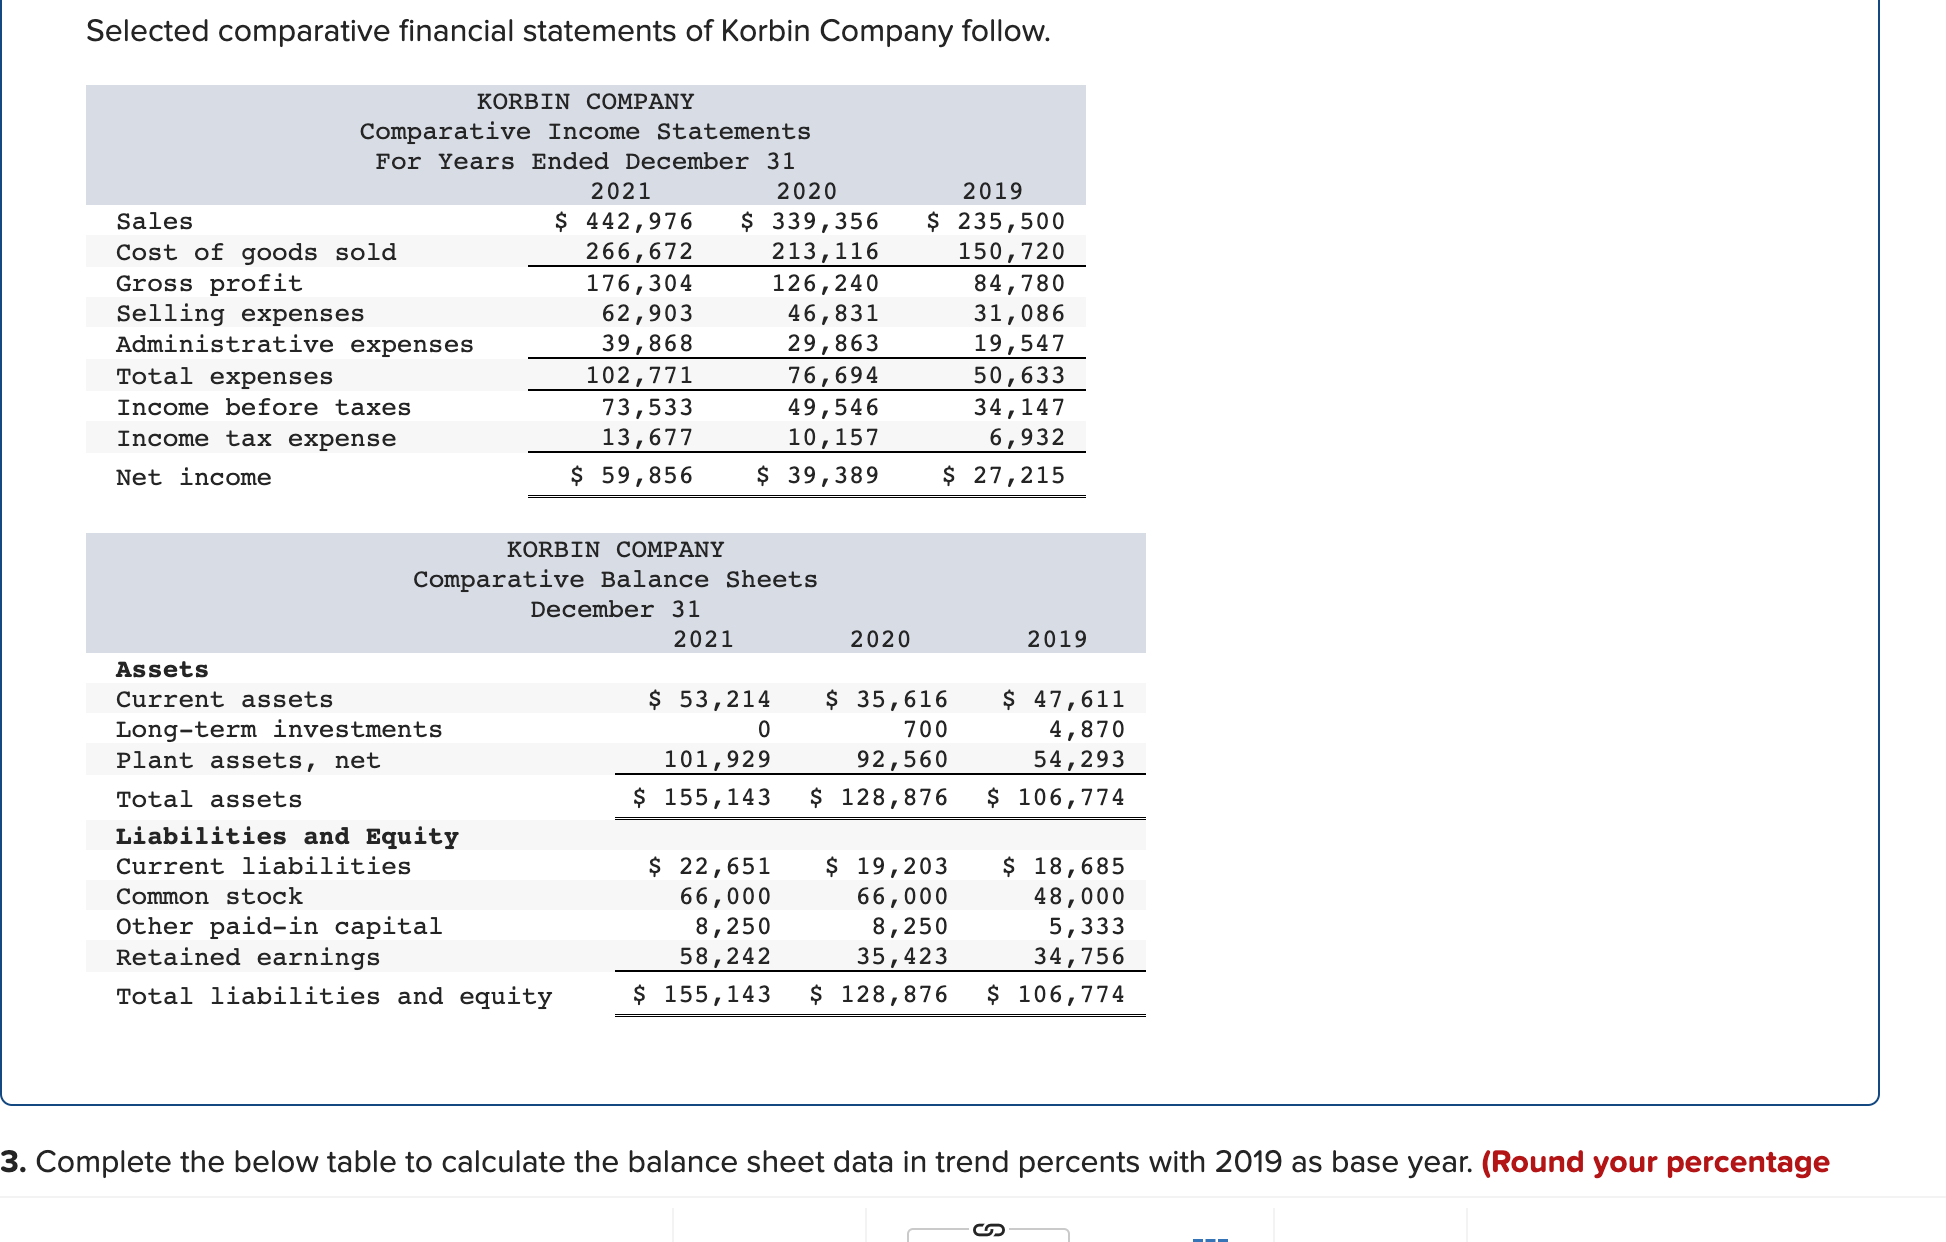
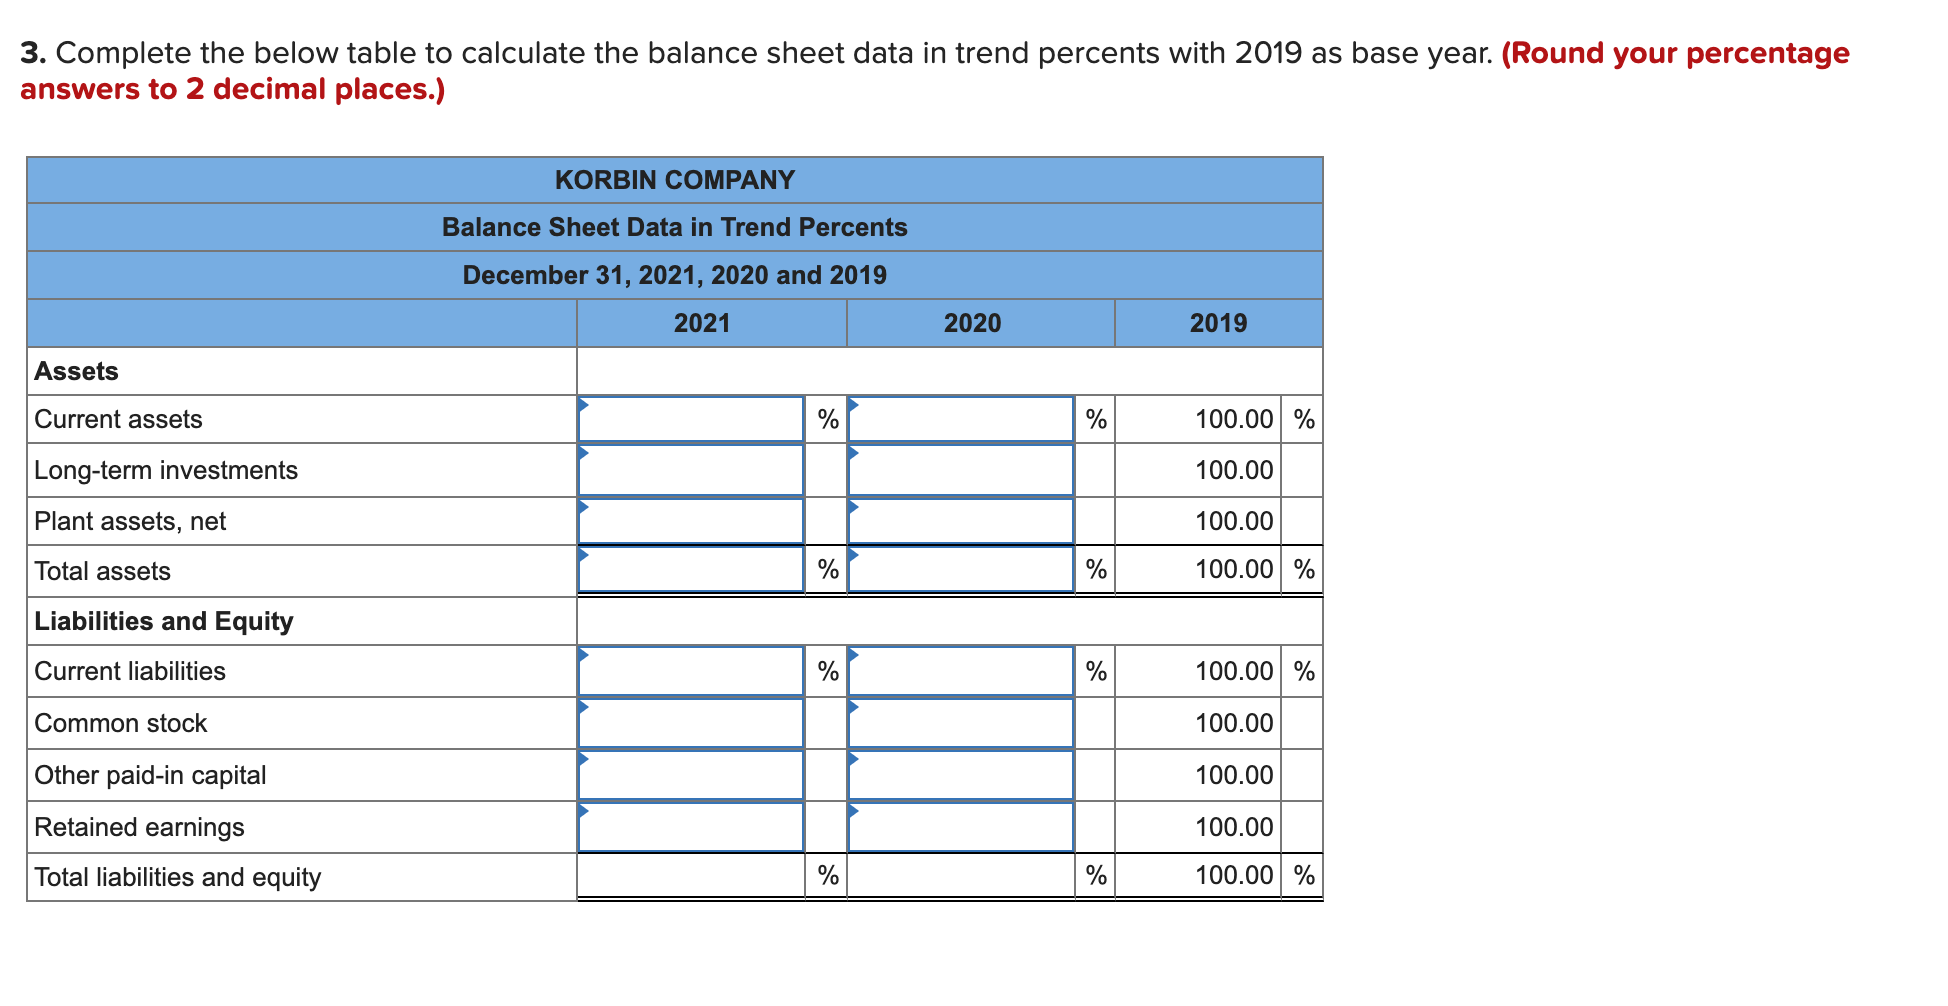
Selected comparative financial statements of Korbin Company follow. KORBIN COMPANY Comparative Income Statements For Years Ended December 31 2021 2020 $ 442,976 $ 339,356 2019 Sales $ 235,500 Cost of goods sold 266,672 213,116 150,720 Gross profit 176,304 126,240 84,780 Selling expenses Total expenses Income before taxes Income tax expense Net income 62,903 46,831 31,086 Administrative expenses 39,868 29,863 19,547 102,771 76,694 50,633 73,533 49,546 34,147 13,677 10,157 6,932 $ 59,856 $ 39,389 $ 27,215 KORBIN COMPANY Comparative Balance Sheets December 31 2021 Assets Current assets $ 53,214 Long-term investments Plant assets, net 0 101,929 Current liabilities Total assets Liabilities and Equity Common stock $ 155,143 $ 128,876 Other paid-in capital Retained earnings $ 22,651 66,000 8,250 58,242 $ 19,203 66,000 Total liabilities and equity $ 155,143 8,250 35,423 34,756 $ 128,876 $ 106,774 2020 $ 35,616 700 92,560 2019 $ 47,611 4,870 54,293 $ 106,774 $ 18,685 48,000 5,333 2. Complete the below table to calculate income statement data in common-size percents. (Round your percentage answers to 2 decimal places.) Sales KORBIN COMPANY Common-Size Comparative Income Statements For Years Ended December 31, 2021, 2020, and 2019 Cost of goods sold Gross profit Selling expenses Administrative expenses Total expenses Income before taxes Income tax expense Net income 2021 % 2020 2019 % % % % % Selected comparative financial statements of Korbin Company follow. KORBIN COMPANY Comparative Income Statements For Years Ended December 31 2021 2019 Sales Cost of goods sold $ 442,976 266,672 2020 $ 339,356 213,116 $ 235,500 150,720 Gross profit 176,304 126,240 84,780 Selling expenses 62,903 46,831 31,086 Administrative expenses 39,868 29,863 19,547 Total expenses 102,771 76,694 50,633 Income before taxes 73,533 49,546 34,147 Income tax expense Net income 13,677 10,157 6,932 $ 59,856 $ 39,389 $ 27,215 KORBIN COMPANY Comparative Balance Sheets December 31 2021 Assets Current assets Long-term investments Plant assets, net Total assets Liabilities and Equity Current liabilities Common stock Other paid-in capital Retained earnings Total liabilities and equity 2020 2019 $ 53,214 0 101,929 $ 155,143 $ 128,876 $ 22,651 66,000 8,250 58,242 $ 19,203 66,000 8,250 35,423 $ 35,616 700 92,560 $ 47,611 4,870 54,293 $ 106,774 $ 18,685 48,000 5,333 34,756 $ 155,143 $ 128,876 $ 106,774 3. Complete the below table to calculate the balance sheet data in trend percents with 2019 as base year. (Round your percentage 3. Complete the below table to calculate the balance sheet data in trend percents with 2019 as base year. (Round your percentage answers to 2 decimal places.) KORBIN COMPANY Balance Sheet Data in Trend Percents December 31, 2021, 2020 and 2019 2021 2020 2019 Assets Current assets Long-term investments % % 100.00 % 100.00 Plant assets, net 100.00 Total assets % % 100.00 % Liabilities and Equity Current liabilities % % 100.00 % Common stock 100.00 Other paid-in capital 100.00 Retained earnings 100.00 Total liabilities and equity % % 100.00 %
Step by Step Solution
There are 3 Steps involved in it
Step: 1

Get Instant Access to Expert-Tailored Solutions
See step-by-step solutions with expert insights and AI powered tools for academic success
Step: 2

Step: 3

Ace Your Homework with AI
Get the answers you need in no time with our AI-driven, step-by-step assistance
Get Started


