

Answered step by step
Verified Expert Solution
Question
1 Approved Answer
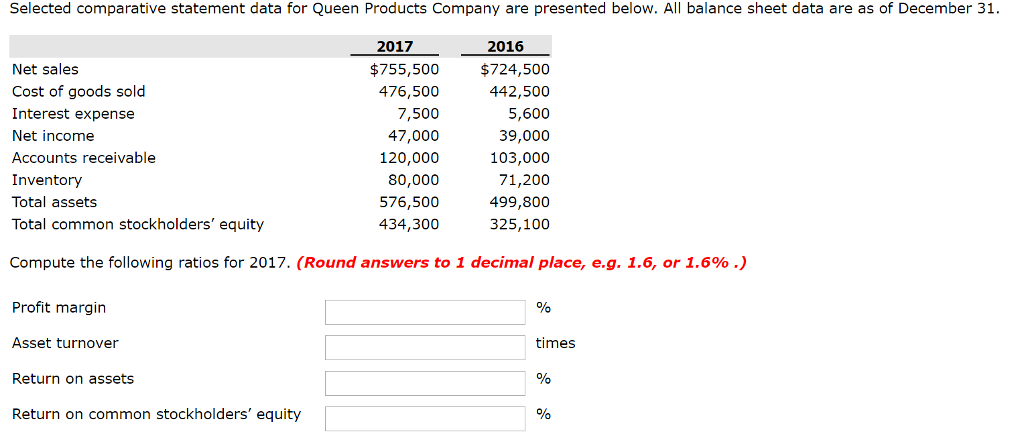
Selected comparative statement data for Queen Products Company are presented below. All balance sheet data are as of December 31 2017 2016 Net sales Cost
Step by Step Solution
There are 3 Steps involved in it
Step: 1

Get Instant Access to Expert-Tailored Solutions
See step-by-step solutions with expert insights and AI powered tools for academic success
Step: 2

Step: 3
Ace Your Homework with AI
Get the answers you need in no time with our AI-driven, step-by-step assistance
Get Started
Audit Customer Satisfaction Marketing Added Value
Authors: Cindy E. Cosmas
1st Edition
089413373X, 978-0894133732