

Answered step by step
Verified Expert Solution
Question
1 Approved Answer
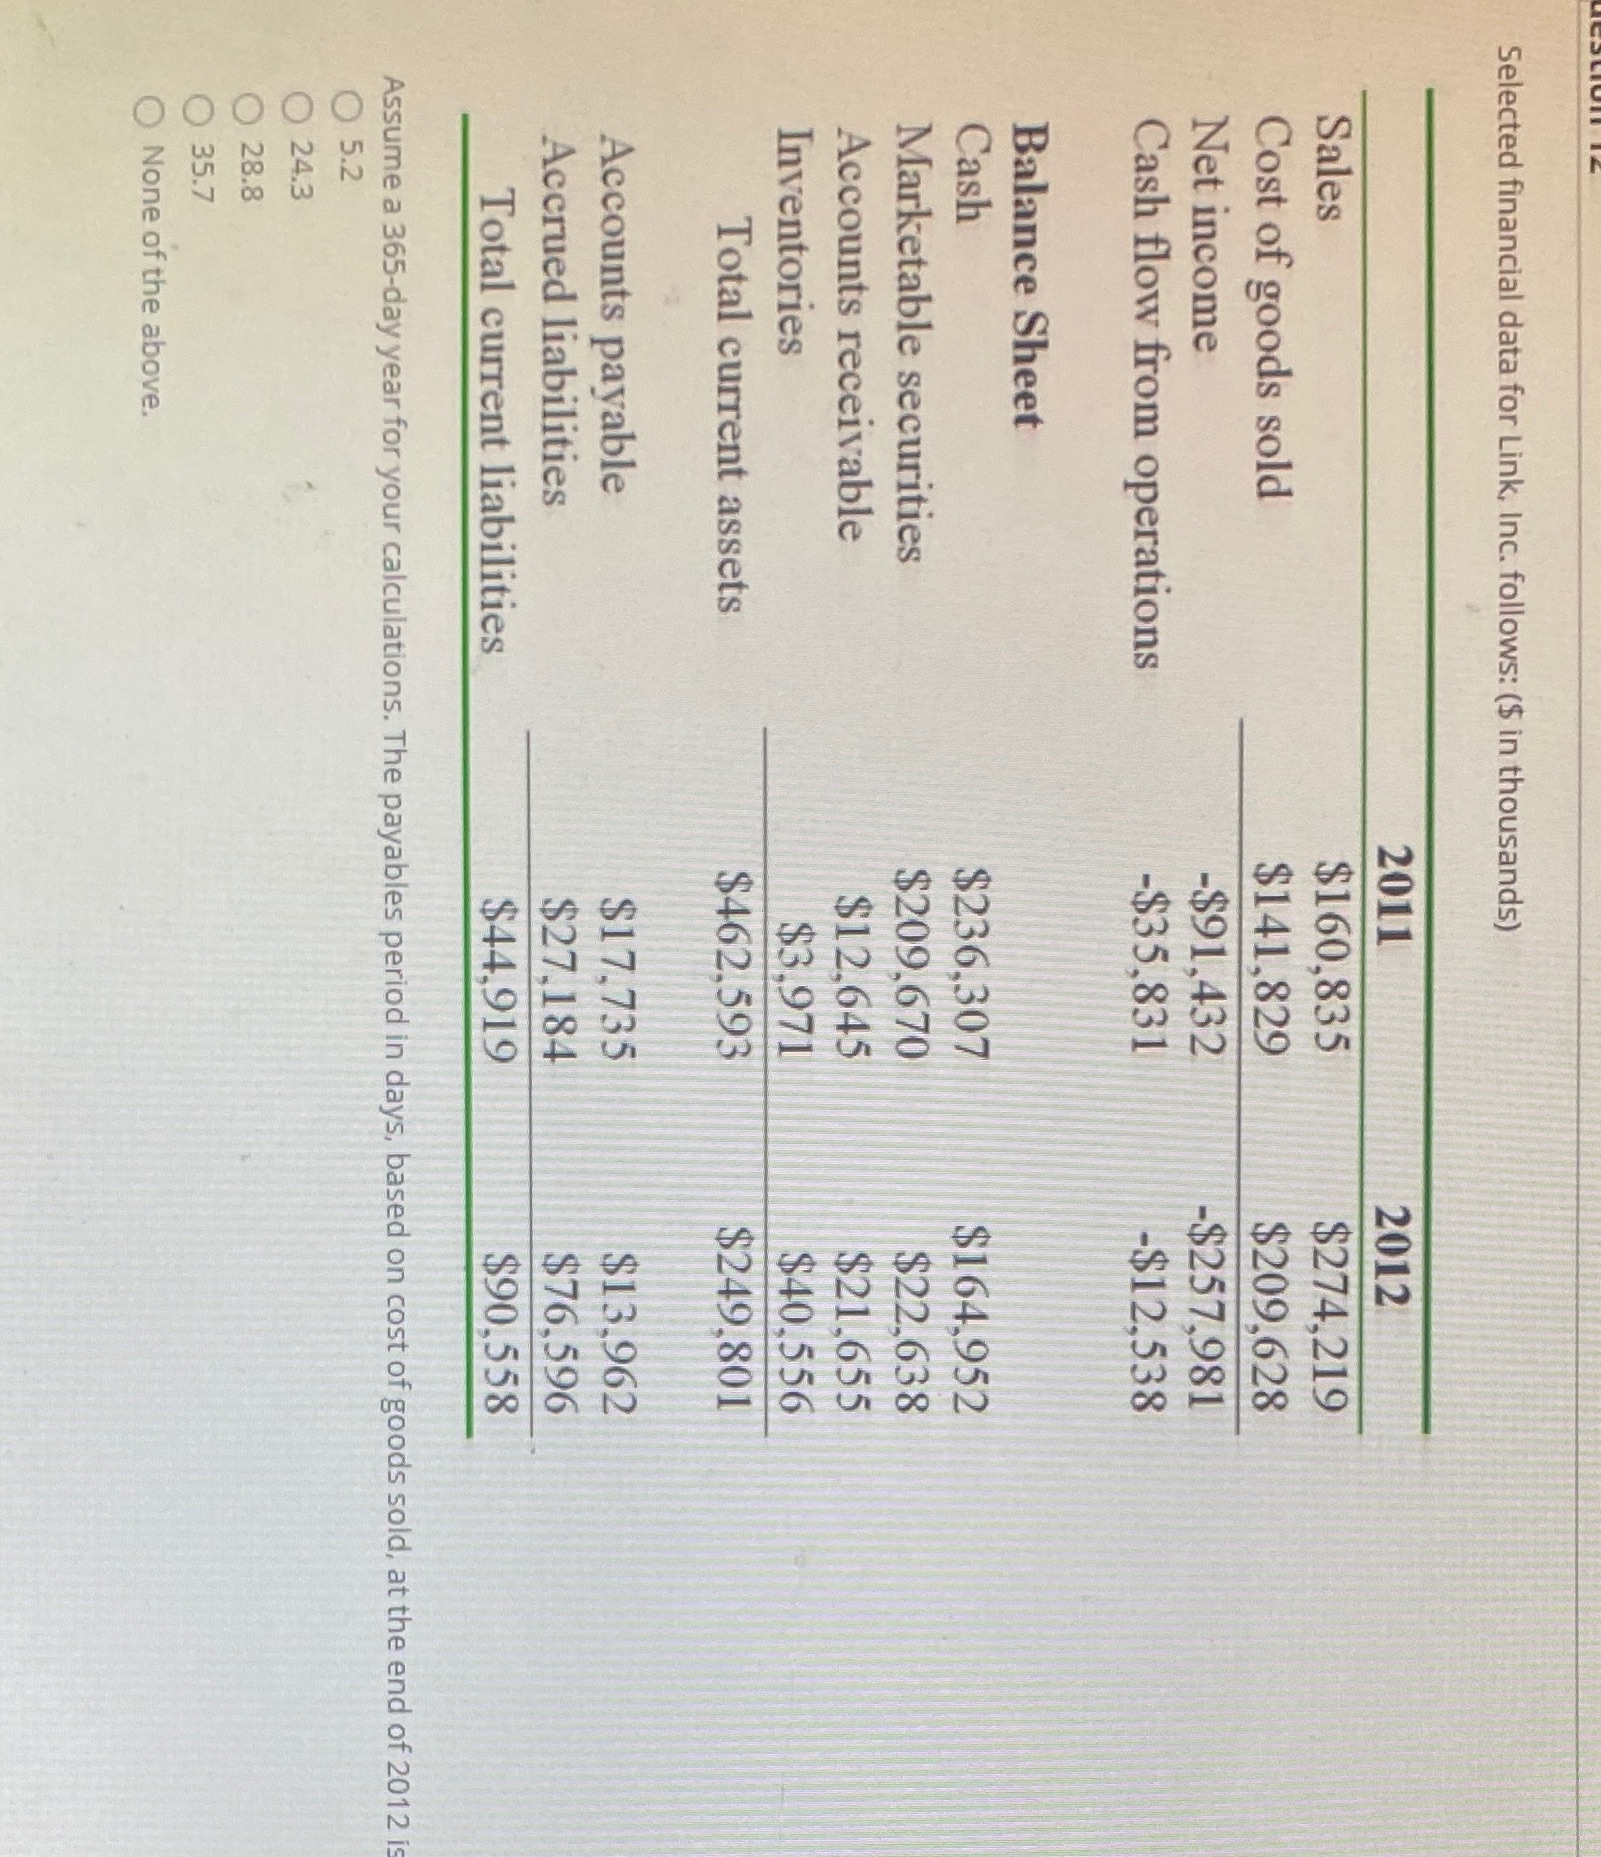
Selected financial data for Link, Inc. follows: ($ in thousands) 2011 2012 Sales $160,835 $274,219 Cost of goods sold $141,829 $209,628 Net income -$91,432 -$257,981

Step by Step Solution
There are 3 Steps involved in it
Step: 1

Get Instant Access to Expert-Tailored Solutions
See step-by-step solutions with expert insights and AI powered tools for academic success
Step: 2

Step: 3
Ace Your Homework with AI
Get the answers you need in no time with our AI-driven, step-by-step assistance
Get Started
Financial Management For Public Health And Not For Profit Organizations
Authors: Steven A. Finkler
2nd Edition
0131471988, 978-0131471986