Answered step by step
Verified Expert Solution
Link Copied!

Question

1 Approved Answer

Selected income statement and balance sheet data (in millions) from companies in different industries: Sales Gross Profit Net Income Total Assets Total Liabilities Target Corp
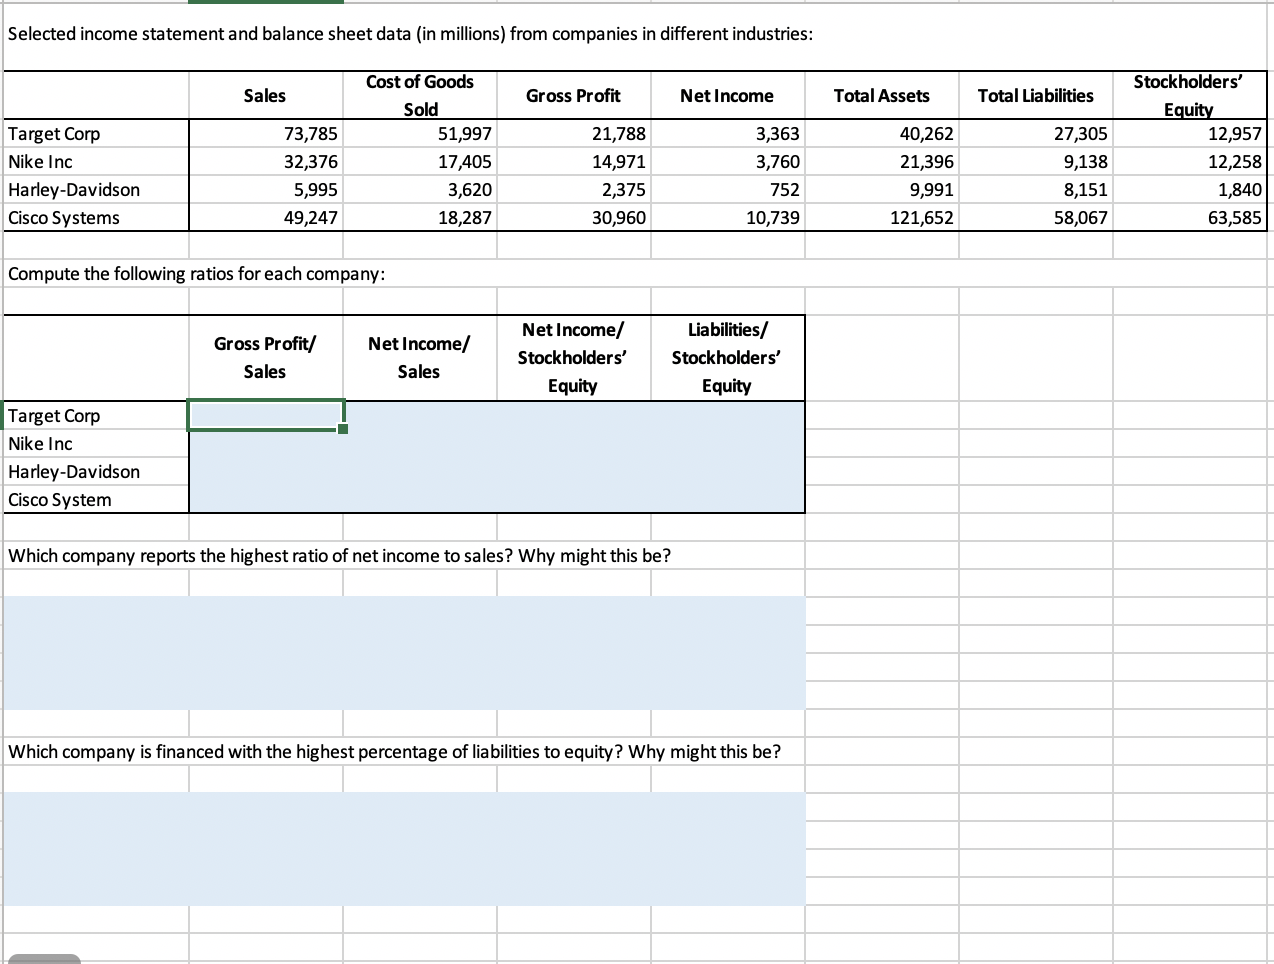
image text in transcribed

Selected income statement and balance sheet data (in millions) from companies in different industries: Sales Gross Profit Net Income Total Assets Total Liabilities Target Corp Nike Inc Harley-Davidson Cisco Systems 73,785 32,376 5,995 49,247 Cost of Goods Sold 51,997 17,405 3,620 18,287 21,788 14,971 2,375 30,960 3,363 3,760 752 10,739 40,262 21,396 9,991 121,652 27,305 9,138 8,151 58,067 Stockholders' Equity 12,957 12,258 1,840 63,585 Compute the following ratios for each company: Gross Profit/ Sales Net Income/ Sales Net Income/ Stockholders' Equity Liabilities/ Stockholders' Equity Target Corp Nike Inc Harley-Davidson Cisco System Which company reports the highest ratio of net income to sales? Why might this be? Which company is financed with the highest percentage of liabilities to equity? Why might this be

Step by Step Solution

There are 3 Steps involved in it

Step: 1

blur-text-image

Get Instant Access to Expert-Tailored Solutions

See step-by-step solutions with expert insights and AI powered tools for academic success

Step: 2

blur-text-image

Step: 3

blur-text-image

Ace Your Homework with AI

Get the answers you need in no time with our AI-driven, step-by-step assistance

Get Started

Recommended Textbook for

Securities Trader Qualification Examination Series 57 Study Guide

Authors: Philip Martin Mccaulay

1st Edition

979-8363665240

More Books

Students also viewed these Finance questions

Question

Explain the characteristics of a good system of control

Answered: 1 week ago

Question

State the importance of control

Answered: 1 week ago

Question

What are the functions of top management?

Answered: 1 week ago

Question

Bring out the limitations of planning.

Answered: 1 week ago