Answered step by step
Verified Expert Solution
Question
1 Approved Answer
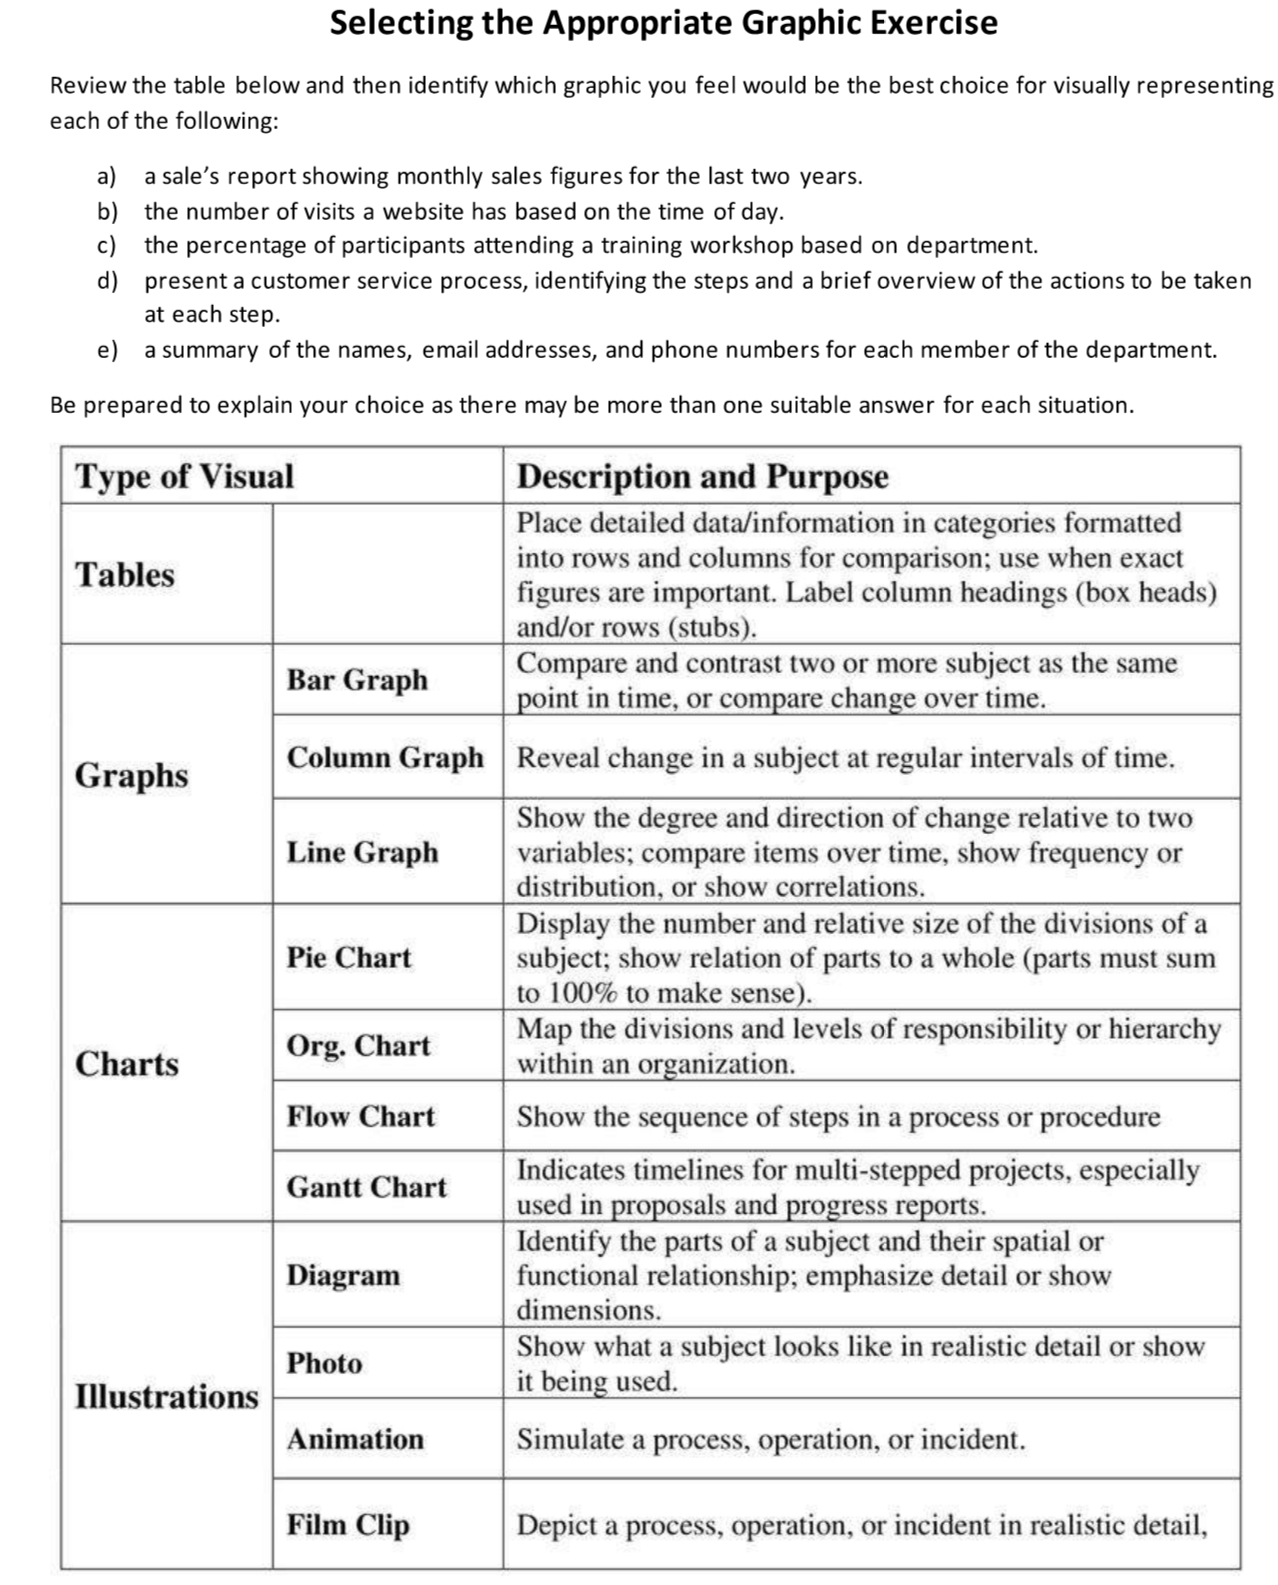
Selecting the Appropriate Graphic Exercise Review the table below and then identify which graphic you feel would be the best choice for visually representing each
Selecting the Appropriate Graphic Exercise
Review the table below and then identify which graphic you feel would be the best choice for visually representing each of the following:
a a sale's report showing monthly sales figures for the last two years.
b the number of visits a website has based on the time of day.
c the percentage of participants attending a training workshop based on department.
d present a customer service process, identifying the steps and a brief overview of the actions to be taken at each step.
e a summary of the names, email addresses, and phone numbers for each member of the department.
Be prepared to explain your choice as there may be more than one suitable answer for each situation.
tableType of Visual,tableDescription and PurposePlace detailed datainformation in categories formattedinto rows and columns for comparison; use when exactfigures are important. Label column headings box headsandor rows stubsTablesGraphsBar Graph,tableCompare and contrast two or more subject as the samepoint in time, or compare change over time.Column Graph,Reveal change in a subject at regular intervals of time.Line Graph,tableShow the degree and direction of change relative to twovariables; compare items over time, show frequency ordistribution or show correlations.ChartsPie Chart,tableDisplay the number and relative size of the divisions of asubject; show relation of parts to a whole parts must sumto to make senseOrg Chart,tableMap the divisions and levels of responsibility or hierarchywithin an organization.Flow Chart,Show the sequence of steps in a process or procedureGantt Chart,tableIndicates timelines for multistepped projects, especiallyused in proposals and progress reports.IllustrationsDiagram,tableIdentify the parts of a subject and their spatial orfunctional relationship; emphasize detail or showdimensionsPhototableShow what a subject looks like in realistic detail or showit being used.AnimationSimulate a process, operation, or incident.Film Clip,Depict a process, operation, or incident in realistic detail,

Step by Step Solution
There are 3 Steps involved in it
Step: 1

Get Instant Access to Expert-Tailored Solutions
See step-by-step solutions with expert insights and AI powered tools for academic success
Step: 2

Step: 3

Ace Your Homework with AI
Get the answers you need in no time with our AI-driven, step-by-step assistance
Get Started


