Sensitivity analysis
Consider the following scenarios for the company and for each scenario calculate the NPV and the IRR and include these analyses in your final recommendation.
a) Perform sensitivity analysis on the unit sales, variable costs and the cost of capital for the project. Assume that each of these variables can vary from its base-case value by 10% and 20%. Summarize the results in a table (NPVs for each sensitivity analysis).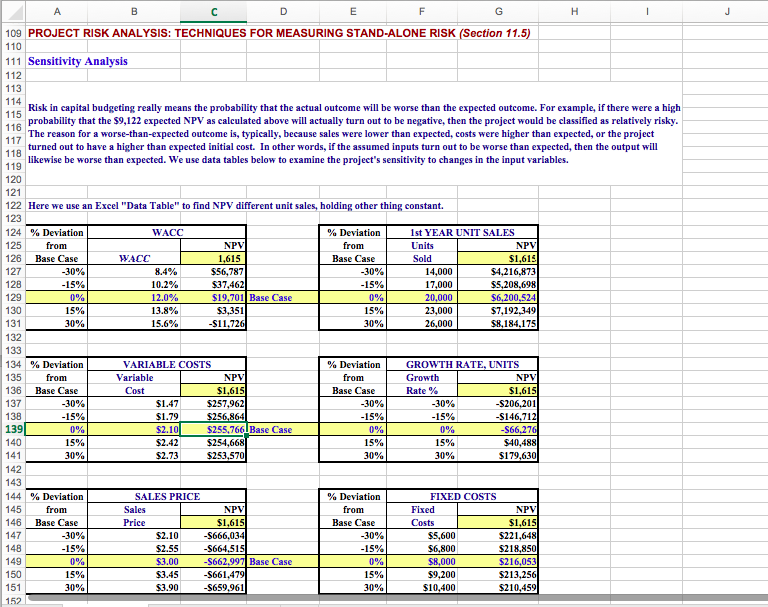
109 PROJECT RISK ANALYSIS: TECHNIQUES FOR MEASURING STAND-ALONE RISK (Section 11.5) 111 Sensitivity Analysis 11 Risk in capital budgeting really means the probability that the actual outcome will be worse than the expected outcome. For example, if there were a high 113 probability that the $9,122 expected NPV as calculated above will actually turn out to be negative, then the project would be classified as relatively risky The reason for a worse-than-expected outcome is, typically, because sales were lower than expected, costs were higher than expected, or the project turned out to have a higher than expected initial cost. In other words, if the assumed inputs turn out to be worse than expected, then the output will likewise be worse than expected. We use data tables below to examine the project's sensitivity to changes in the input variables. 122 Here we use an Excel "Data Table" to find NPV different unit sales, holding other thing constant 124 % Deviation 125 from 126 Base Case WACC st YEAR UNIT SALES Units Sold NP from NPV WACC -30% 8.4% 10.2% 12.0% 13.8% $56,787 37,46 $19,701 Base Case $3,351 $11 -30% 14,000 17,000 20,000 $4,216.873 $5,208.698 00,524 $7,192.349 $8,184,175 15% 15% 26,000 134 % Deviation 135 from 136 Base Case VARIABLE COSTS GROWTH RATE, UNITS Variable NP NPV Cost Rate % -30% $1.47 $257,962 -30% 15% -30% 15% S206.201 139 140 $255,766Base Case S66.27 $40,488 $179,630 15% 15% 15% $2.42 $2.73 $253,570 144 % Deviation 145from 146 Base Case SALES PRICE FIXED COSTS NP from NP Costs $221,648 $218,850 $216,053 $213.256 $210,459 -30% -30% 15% $2.55 $3.00 $3.45 $3.90 S664,515 S662.9 S661,47 S659.961 $6,800 $8,000 $9,200 15% 15% 151 109 PROJECT RISK ANALYSIS: TECHNIQUES FOR MEASURING STAND-ALONE RISK (Section 11.5) 111 Sensitivity Analysis 11 Risk in capital budgeting really means the probability that the actual outcome will be worse than the expected outcome. For example, if there were a high 113 probability that the $9,122 expected NPV as calculated above will actually turn out to be negative, then the project would be classified as relatively risky The reason for a worse-than-expected outcome is, typically, because sales were lower than expected, costs were higher than expected, or the project turned out to have a higher than expected initial cost. In other words, if the assumed inputs turn out to be worse than expected, then the output will likewise be worse than expected. We use data tables below to examine the project's sensitivity to changes in the input variables. 122 Here we use an Excel "Data Table" to find NPV different unit sales, holding other thing constant 124 % Deviation 125 from 126 Base Case WACC st YEAR UNIT SALES Units Sold NP from NPV WACC -30% 8.4% 10.2% 12.0% 13.8% $56,787 37,46 $19,701 Base Case $3,351 $11 -30% 14,000 17,000 20,000 $4,216.873 $5,208.698 00,524 $7,192.349 $8,184,175 15% 15% 26,000 134 % Deviation 135 from 136 Base Case VARIABLE COSTS GROWTH RATE, UNITS Variable NP NPV Cost Rate % -30% $1.47 $257,962 -30% 15% -30% 15% S206.201 139 140 $255,766Base Case S66.27 $40,488 $179,630 15% 15% 15% $2.42 $2.73 $253,570 144 % Deviation 145from 146 Base Case SALES PRICE FIXED COSTS NP from NP Costs $221,648 $218,850 $216,053 $213.256 $210,459 -30% -30% 15% $2.55 $3.00 $3.45 $3.90 S664,515 S662.9 S661,47 S659.961 $6,800 $8,000 $9,200 15% 15% 151