Question
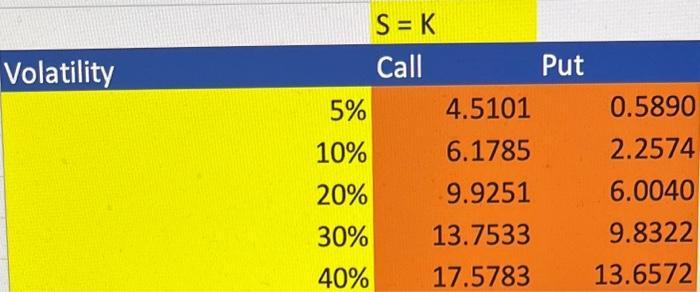
Sensitivity Analysis, Discuss and interpret the results of sensitivity analysis. Volatility 5% 10% 20% 30% 40% S=K Call 4.5101 6.1785 9.9251 13.7533 17.5783 Put 0.5890

Volatility 5% 10% 20% 30% 40% S=K Call 4.5101 6.1785 9.9251 13.7533 17.5783 Put 0.5890 2.2574 6.0040 9.8322 13.6572
Step by Step Solution
3.53 Rating (156 Votes )
There are 3 Steps involved in it
Step: 1
The results of sensitivity analysis show that as the volatility increases the call and pu...
Get Instant Access to Expert-Tailored Solutions
See step-by-step solutions with expert insights and AI powered tools for academic success
Step: 2

Step: 3

Ace Your Homework with AI
Get the answers you need in no time with our AI-driven, step-by-step assistance
Get StartedRecommended Textbook for
Introductory Statistics Exploring The World Through Data
Authors: Robert Gould, Colleen Ryan
2nd Edition
9780321978509, 321978277, 321978501, 978-0321978271
Students also viewed these Accounting questions
Question
Answered: 1 week ago
Question
Answered: 1 week ago
Question
Answered: 1 week ago
Question
Answered: 1 week ago
Question
Answered: 1 week ago
Question
Answered: 1 week ago
Question
Answered: 1 week ago
Question
Answered: 1 week ago
Question
Answered: 1 week ago
Question
Answered: 1 week ago
Question
Answered: 1 week ago
Question
Answered: 1 week ago
Question
Answered: 1 week ago
Question
Answered: 1 week ago
Question
Answered: 1 week ago
Question
Answered: 1 week ago
Question
Answered: 1 week ago
Question
Answered: 1 week ago
Question
Answered: 1 week ago
Question
Answered: 1 week ago
Question
Answered: 1 week ago
View Answer in SolutionInn App


