Sensitivity of NPV
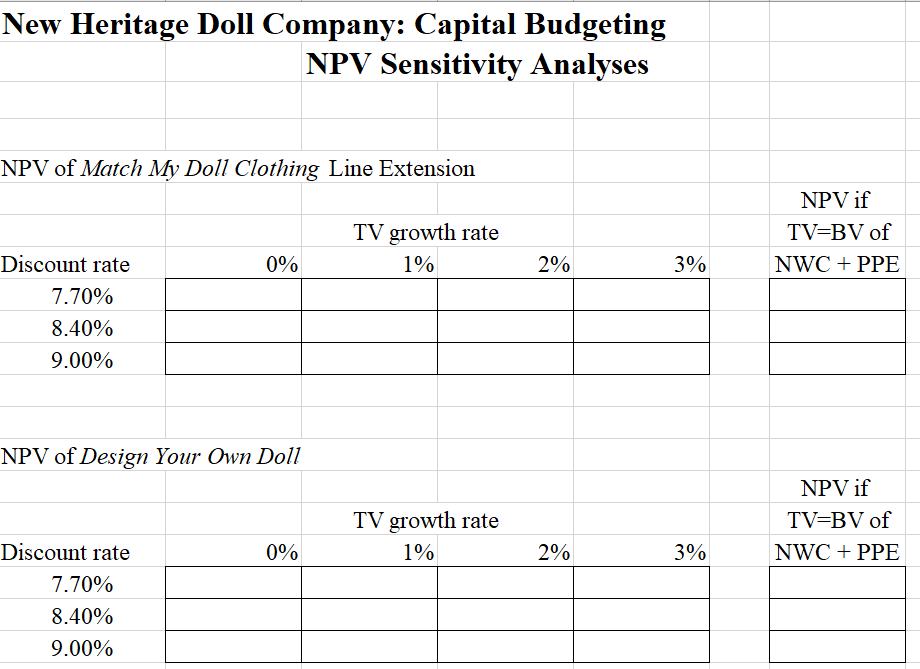
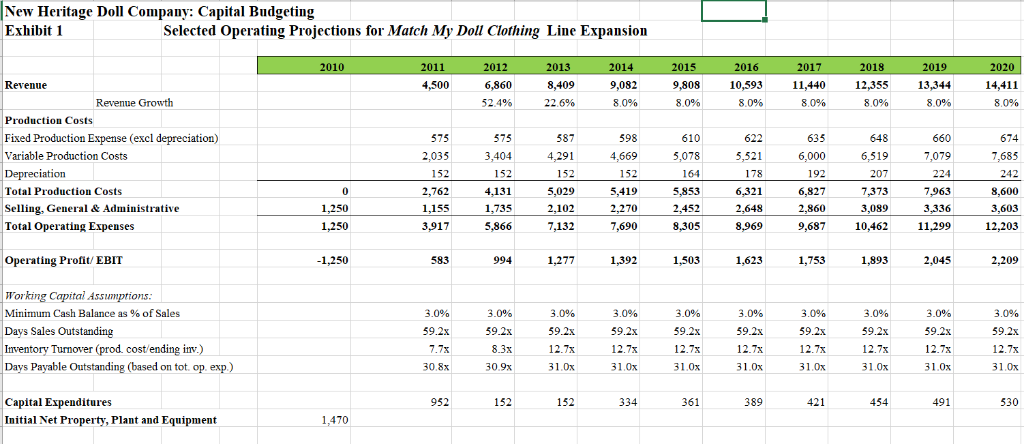
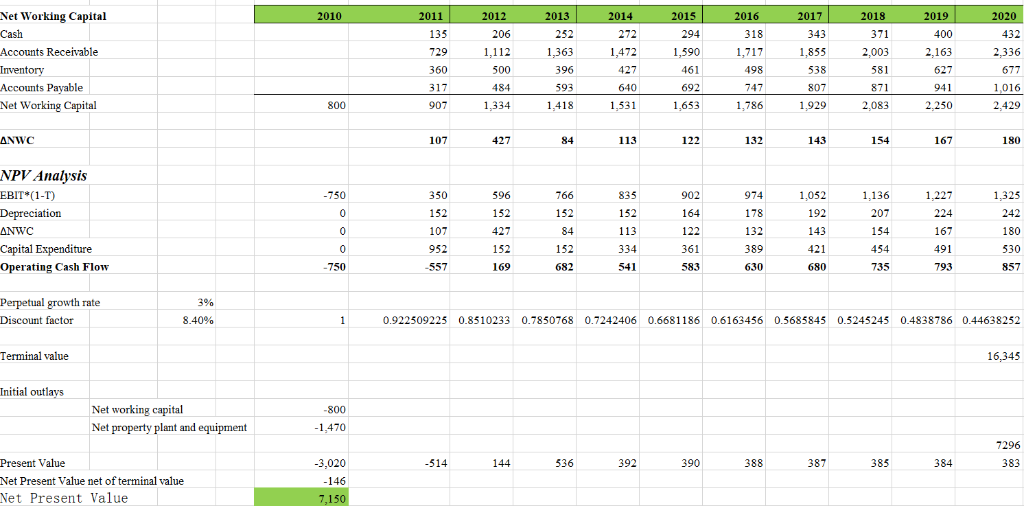

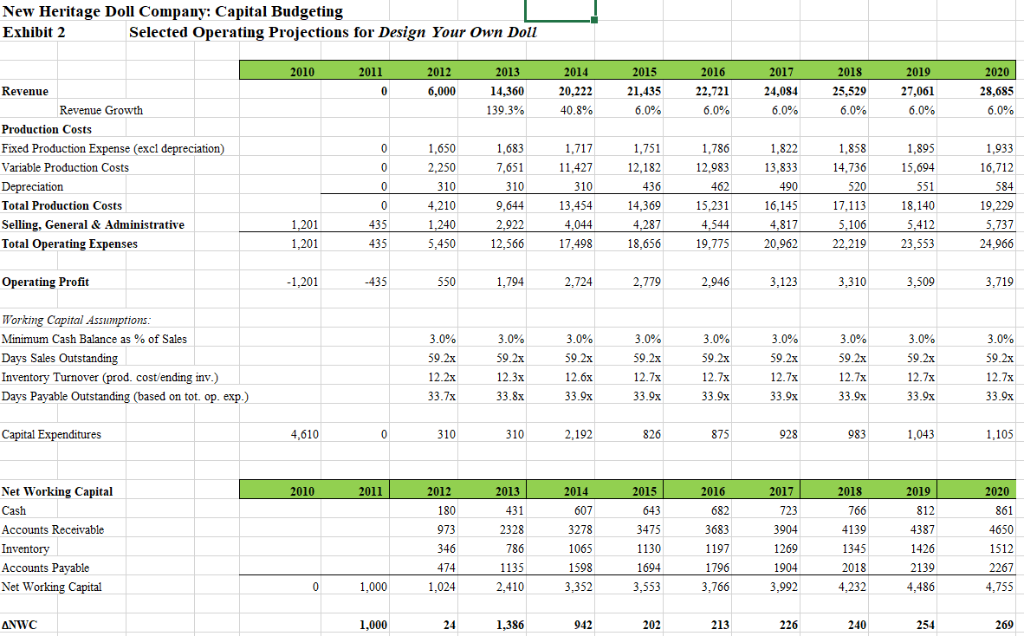
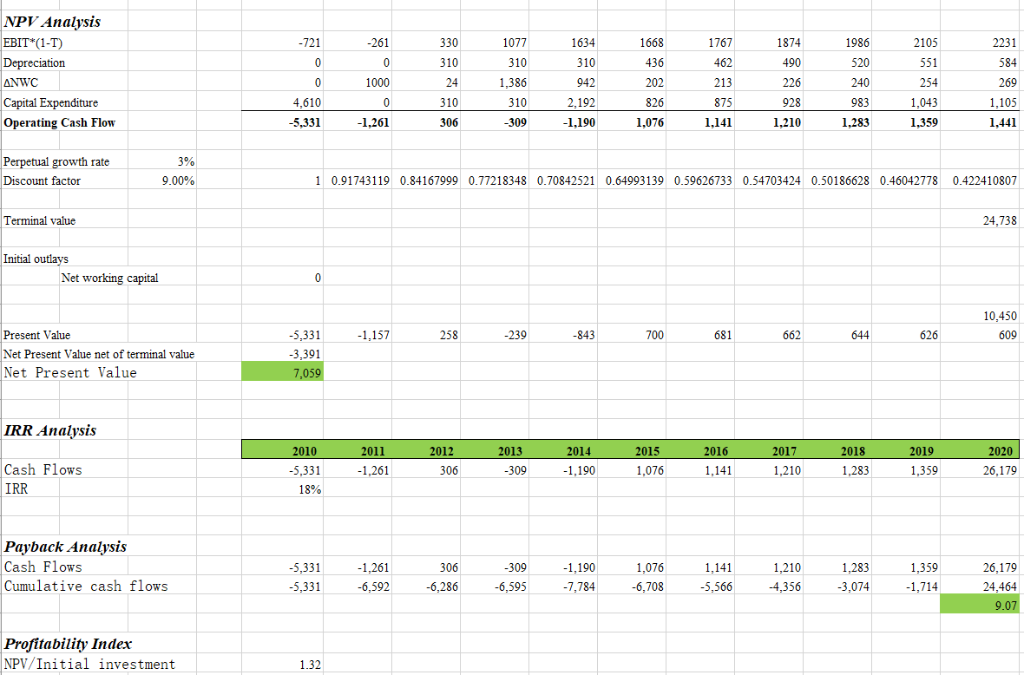
New Heritage Doll Company: Capital Budgeting NPV Sensitivitv Analvses NPV of Match My Doll Clothing Line Extension NPV if TV growth rate TV-BV of 0% 1% 2% NWC +PPE Discount rate 3% 7 000 8.40% 9.0000 NPV of Design Your Own Doll NPV if TV growth rate TV-BV of 0% 1% 290 NWC +PPE Discount rate 3% 7 000 8.40% 9.00% New Heritage Doll Company: Capital Budgeting Exhibit 1 Selected Operating Projections for Match My Doll Clothing Line Expansion 2019 2018 2014 2020 Revenue 4,500 8,409 9,808 10,93 11,440 12,355 13,344 14,411 6,860 Revenue Growth 8.0% 8096 8096 8.0% 80% 8096 52 496 22.6% 8.0% Production Costs 648 Fixed Production Expense (excl depreciation) 575 575 587 610 635 660 598 Variable Production Costs 2,035 3,404 4,2914,669 5,0785,521 6,0006,519 7079 7,685 Depreciation 207 5,029 5,419 6,827 7,373 Total Production Costs 2,762 5,853 8,600 1,735 2,452 3,603 Selling, General& Administrative 1,250 2,102 2,648 2,860 3,336 Total Operating Expenses 50 7,132 7,690 8,305 8,969 9,68710,46211299 12,203 5,866 1,753 Operating Profit/ EBIT 50 583 994 1,392 1,503 1,623 1,893 2,209 2,045 Working Capital Assumptions: 3.0% 3.0% 3.0% 3.0% 3.0% Minimum Cash Balance as % of Sales 3.0% 3.0% 3.0% 3.0% 3.0% Days Sales Outstanding Inventory Turnover (prod cost/ending inv.) Days Payable Outstanding (based on tot op exp) 59.2x 59.2x 59.2x 59.2x 59.2x 59.2x 59.2x 59.2x 59.2x 59.2x 12.7x 12.7x 12.7x 12.7x 12.7x 12.7x 12.7x 31.0x 30.8x 30.9x 31.0x 31.0x 31,0x 31.0x 31,0x 152 152 Capital Expenditures 361 389 491 530 Initial Net Property, Plant and Equipment 1,470 Net Working Capital 010 01 01 018 201 371 135 400 206 252 272 294 343 432 Accounts Receivable 29 1,1121,36:3 1,717 2.003 2,163 461 498 581 500 396 538 427 627 871 Accounts Payable 484 640 692 747 807 1,418 907 Net Working Capital 1,531 1,653 1,786 800 2,083 2,250 2,429 113 167 ANWC 427 180 84 122 132 143 NPV Analysis EBIT (1-T) 350 902 1,052 1,325 750 596 766 835 974 1,136 1,227 152 178 152 152 152 192 207 143 107 122 132 180 ANWC 84 167 427 491 Capital Expenditure 952 361 454 152 152 334 389 530 541 169 735 793 Operating Cash Flow 750 557 682 583 630 857 680 Perpetual growth rate Discount factor 8.40% 0.922509225 0.8510233 0.7850768 0.7242406 0.6681186 0.6163456 0.5685845 0.5245245 0.4838786 0.44638252 Terminal value Initial outlays Net working capital Net property plant and equipment 800 1,470 7296 514 Present Value 144 536 392 390 388 387 385 384 Net Present Value net of terminal value Net Present Value RR Analysis 201 Cash Flows 169 541 793 17,202 3,020 557 682 583 630 680 735 IRR 2490 Payback Analysis Cash Flows 169 735 3,020 557 682 541 583 630 680 793 17,202 Cumulative cash flows 3,408 972 291 443 1,237 3,577 2,726 2,185 1,602 18,439 Profitability Index NPV/Initial investment 2.37 New Heritage Doll Company: Capital Budgeting Selected Operating Projections for Design Your Own Doll Exhibit 2 2010 012 2013 2016 2018 2019 2020 2014 2015 6,000 14,3020,222 21,43522,721 25,529 Revenue 24,084 27,061 139.3% Revenue Growth 40.8% 6.0% 6.0% 6.0% 6.0% 6.0% Production Costs 1,683 Fixed Production Expense (excl depreciation) Variable Production Costs 7,65111.427 12,182 12,983 13,833 14,736 15,694 436 Total Production Costs 9,64413,454 14,369 15,231 16,14517,113 18,140 Selling, General& Administrative 4,044 435 Total Operating Expenses 45012,566 7,4918,656 19,775 20,962 22,219 23,553 24,966 435 2,724 Operating Profit 1,201 -435 Working Capital Assumptions Minimum Cash Balance as % of Sales 3.0% 3.0% 3.0% 3.0% 3.0% 3.0% 3.0% Days Sales Outstanding 59.2x 59.2x 9.2x 59.2x 9.2x 59.2x 59.2x 59.2x Inventory Turnover (prod. cost ending inv.) Days Payable Outstanding (based on tot. op. exp.) 12.3x 12.6x 12.7x 12.7x 12.7x 12.7x 12.7x 12.7x 12.2x 33.7 33.8x 33.9x 33.9x 33.9x 33.9x 33.9x 33.9x 33.9x Capital Expenditures 010 015 016 017 Net Working Capital 011 2014 Cash 723 431 682 3683 Accounts Receivable 3278 3475 3904 4387 4650 4139 346 1065 1130 1269 1345 1426 1512 1197 2139 Accounts Pavable 1135 1598 1694 1796 1904 2018 2267 474 2,410 Net Working Capital 1,000 4,232 4,755 4,486 1,000 ANWC 942 202 NPV Analysis 261 2231 EBIT (1 330 1077 1668 1767 1874 2105 1634 1986 436 520 584 490 226 1000 1,386 942 202 254 ANWO 1,105 2,192 Capital Expenditure 4,610 310 875 928 983 1,043 1,141 Operating Cash Flow 5,331 1,261 306 309 1.190 1,076 1,210 1,283 1.359 1,441 growth rate Discount factor 9.00% 0.91743119 0.84167999 0.77218348 0.7084252 0.64993139 0.59626733 0.54703424 0.50186628 0.46042778 0.422410807 Terminal value 24,738 Initial outlays Net working capital 10,450 5,331 258 843 700 Present Value 1,157 239 681 662 644 626 3,391 Net Present Value net of terminal value Net Present Value RR Analysis 2011 2012 2013 2010 2014 2015 2016 2017 2018 2019 2020 Cash Flows 306 1,190 1,076 1,141 1,261 309 1,283 26,179 IRR 18% Payback Analysis Cash Flows 1,261 309 1,190 1,076 ,141 26,179 Cumulative cash flows 5,5664,356 3,074 1,714 5,33152,2866,5957,784-6,708 24,464 Profitability Index NPV/Initial investment 1.32 New Heritage Doll Company: Capital Budgeting NPV Sensitivitv Analvses NPV of Match My Doll Clothing Line Extension NPV if TV growth rate TV-BV of 0% 1% 2% NWC +PPE Discount rate 3% 7 000 8.40% 9.0000 NPV of Design Your Own Doll NPV if TV growth rate TV-BV of 0% 1% 290 NWC +PPE Discount rate 3% 7 000 8.40% 9.00% New Heritage Doll Company: Capital Budgeting Exhibit 1 Selected Operating Projections for Match My Doll Clothing Line Expansion 2019 2018 2014 2020 Revenue 4,500 8,409 9,808 10,93 11,440 12,355 13,344 14,411 6,860 Revenue Growth 8.0% 8096 8096 8.0% 80% 8096 52 496 22.6% 8.0% Production Costs 648 Fixed Production Expense (excl depreciation) 575 575 587 610 635 660 598 Variable Production Costs 2,035 3,404 4,2914,669 5,0785,521 6,0006,519 7079 7,685 Depreciation 207 5,029 5,419 6,827 7,373 Total Production Costs 2,762 5,853 8,600 1,735 2,452 3,603 Selling, General& Administrative 1,250 2,102 2,648 2,860 3,336 Total Operating Expenses 50 7,132 7,690 8,305 8,969 9,68710,46211299 12,203 5,866 1,753 Operating Profit/ EBIT 50 583 994 1,392 1,503 1,623 1,893 2,209 2,045 Working Capital Assumptions: 3.0% 3.0% 3.0% 3.0% 3.0% Minimum Cash Balance as % of Sales 3.0% 3.0% 3.0% 3.0% 3.0% Days Sales Outstanding Inventory Turnover (prod cost/ending inv.) Days Payable Outstanding (based on tot op exp) 59.2x 59.2x 59.2x 59.2x 59.2x 59.2x 59.2x 59.2x 59.2x 59.2x 12.7x 12.7x 12.7x 12.7x 12.7x 12.7x 12.7x 31.0x 30.8x 30.9x 31.0x 31.0x 31,0x 31.0x 31,0x 152 152 Capital Expenditures 361 389 491 530 Initial Net Property, Plant and Equipment 1,470 Net Working Capital 010 01 01 018 201 371 135 400 206 252 272 294 343 432 Accounts Receivable 29 1,1121,36:3 1,717 2.003 2,163 461 498 581 500 396 538 427 627 871 Accounts Payable 484 640 692 747 807 1,418 907 Net Working Capital 1,531 1,653 1,786 800 2,083 2,250 2,429 113 167 ANWC 427 180 84 122 132 143 NPV Analysis EBIT (1-T) 350 902 1,052 1,325 750 596 766 835 974 1,136 1,227 152 178 152 152 152 192 207 143 107 122 132 180 ANWC 84 167 427 491 Capital Expenditure 952 361 454 152 152 334 389 530 541 169 735 793 Operating Cash Flow 750 557 682 583 630 857 680 Perpetual growth rate Discount factor 8.40% 0.922509225 0.8510233 0.7850768 0.7242406 0.6681186 0.6163456 0.5685845 0.5245245 0.4838786 0.44638252 Terminal value Initial outlays Net working capital Net property plant and equipment 800 1,470 7296 514 Present Value 144 536 392 390 388 387 385 384 Net Present Value net of terminal value Net Present Value RR Analysis 201 Cash Flows 169 541 793 17,202 3,020 557 682 583 630 680 735 IRR 2490 Payback Analysis Cash Flows 169 735 3,020 557 682 541 583 630 680 793 17,202 Cumulative cash flows 3,408 972 291 443 1,237 3,577 2,726 2,185 1,602 18,439 Profitability Index NPV/Initial investment 2.37 New Heritage Doll Company: Capital Budgeting Selected Operating Projections for Design Your Own Doll Exhibit 2 2010 012 2013 2016 2018 2019 2020 2014 2015 6,000 14,3020,222 21,43522,721 25,529 Revenue 24,084 27,061 139.3% Revenue Growth 40.8% 6.0% 6.0% 6.0% 6.0% 6.0% Production Costs 1,683 Fixed Production Expense (excl depreciation) Variable Production Costs 7,65111.427 12,182 12,983 13,833 14,736 15,694 436 Total Production Costs 9,64413,454 14,369 15,231 16,14517,113 18,140 Selling, General& Administrative 4,044 435 Total Operating Expenses 45012,566 7,4918,656 19,775 20,962 22,219 23,553 24,966 435 2,724 Operating Profit 1,201 -435 Working Capital Assumptions Minimum Cash Balance as % of Sales 3.0% 3.0% 3.0% 3.0% 3.0% 3.0% 3.0% Days Sales Outstanding 59.2x 59.2x 9.2x 59.2x 9.2x 59.2x 59.2x 59.2x Inventory Turnover (prod. cost ending inv.) Days Payable Outstanding (based on tot. op. exp.) 12.3x 12.6x 12.7x 12.7x 12.7x 12.7x 12.7x 12.7x 12.2x 33.7 33.8x 33.9x 33.9x 33.9x 33.9x 33.9x 33.9x 33.9x Capital Expenditures 010 015 016 017 Net Working Capital 011 2014 Cash 723 431 682 3683 Accounts Receivable 3278 3475 3904 4387 4650 4139 346 1065 1130 1269 1345 1426 1512 1197 2139 Accounts Pavable 1135 1598 1694 1796 1904 2018 2267 474 2,410 Net Working Capital 1,000 4,232 4,755 4,486 1,000 ANWC 942 202 NPV Analysis 261 2231 EBIT (1 330 1077 1668 1767 1874 2105 1634 1986 436 520 584 490 226 1000 1,386 942 202 254 ANWO 1,105 2,192 Capital Expenditure 4,610 310 875 928 983 1,043 1,141 Operating Cash Flow 5,331 1,261 306 309 1.190 1,076 1,210 1,283 1.359 1,441 growth rate Discount factor 9.00% 0.91743119 0.84167999 0.77218348 0.7084252 0.64993139 0.59626733 0.54703424 0.50186628 0.46042778 0.422410807 Terminal value 24,738 Initial outlays Net working capital 10,450 5,331 258 843 700 Present Value 1,157 239 681 662 644 626 3,391 Net Present Value net of terminal value Net Present Value RR Analysis 2011 2012 2013 2010 2014 2015 2016 2017 2018 2019 2020 Cash Flows 306 1,190 1,076 1,141 1,261 309 1,283 26,179 IRR 18% Payback Analysis Cash Flows 1,261 309 1,190 1,076 ,141 26,179 Cumulative cash flows 5,5664,356 3,074 1,714 5,33152,2866,5957,784-6,708 24,464 Profitability Index NPV/Initial investment 1.32


