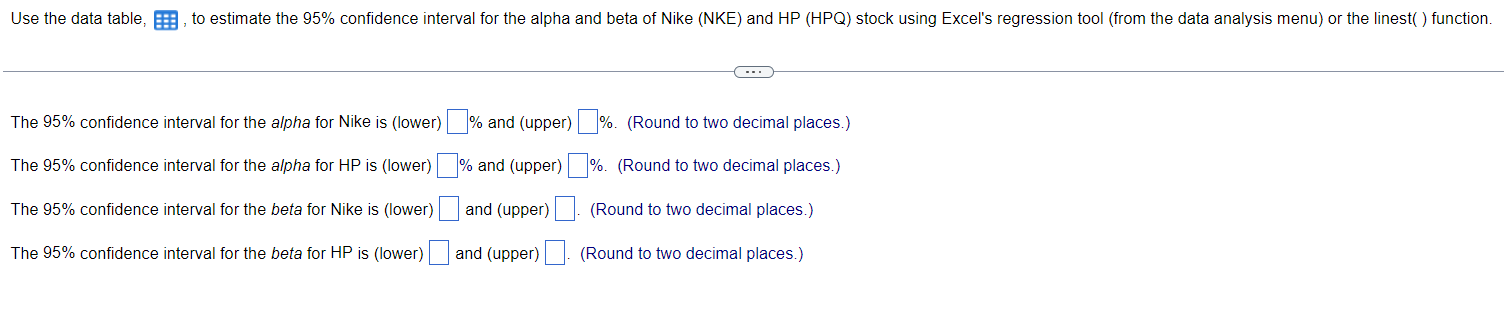
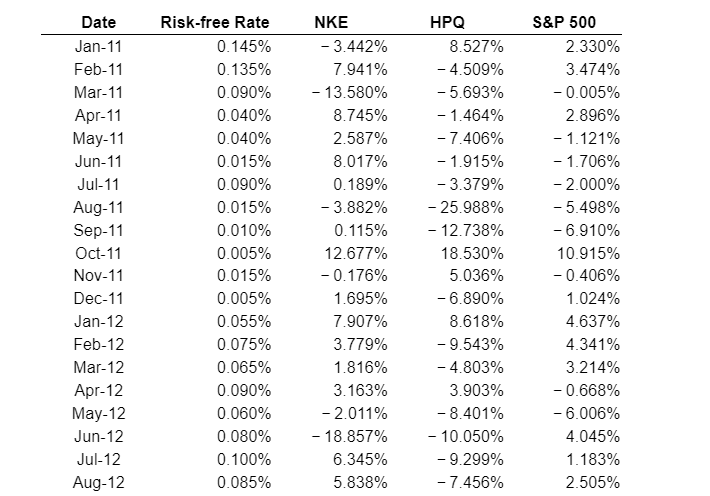
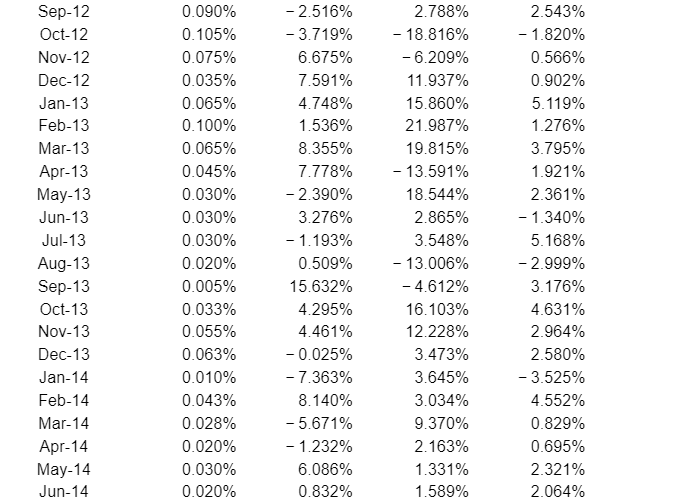
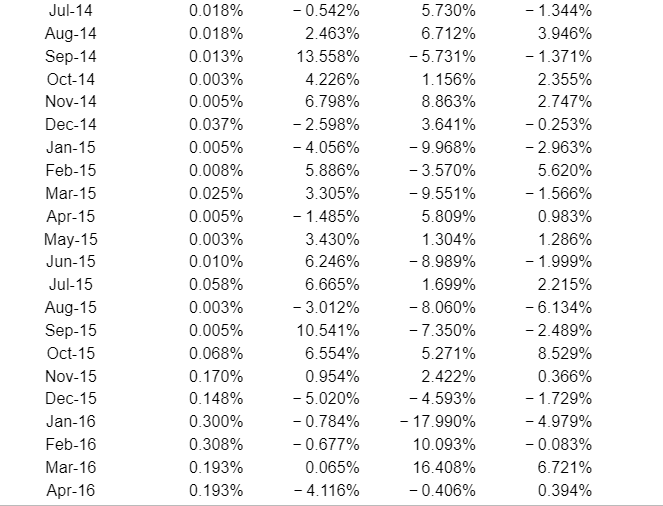
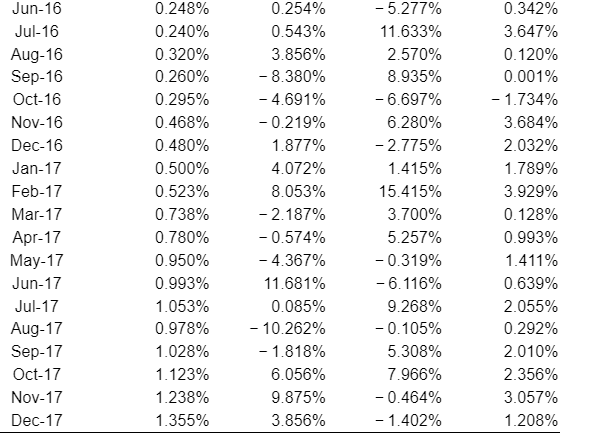
Sep-12Oct-12Nov-12Dec-12Jan-13Feb-13Mar-13Apr-13May-13Jun-13Jul-13Aug-13Sep-13Oct-13Nov-13Dec-13Jan-14Feb-14Mar-14Apr-14May-14Jun-140.090%0.105%0.075%0.035%0.065%0.100%0.065%0.045%0.030%0.030%0.030%0.020%0.005%0.033%0.055%0.063%0.010%0.043%0.028%0.020%0.030%0.020%2.516%3.719%6.675%7.591%4.748%1.536%8.355%7.778%2.390%3.276%1.193%0.509%15.632%4.295%4.461%0.025%7.363%8.140%5.671%1.232%6.086%0.832%2.788%18.816%6.209%11.937%15.860%21.987%19.815%13.591%18.544%2.865%3.548%13.006%4.612%16.103%12.228%3.473%3.645%3.034%9.370%2.163%1.331%1.589%2.543%1.820%0.566%0.902%5.119%1.276%3.795%1.921%2.361%1.340%5.168%2.999%3.176%4.631%2.964%2.580%3.525%4.552%0.829%0.695%2.321%2.064% Use the data table, , to estimate the 95% confidence interval for the alpha and beta of Nike (NKE) and HP (HPQ) stock using Excel's regression tool (from the data analysis menu) or the linest() function. The 95% confidence interval for the alpha for Nike is (lower) \% and (upper) \%. (Round to two decimal places.) The 95% confidence interval for the alpha for HP is (lower) \% and (upper) \%. (Round to two decimal places.) The 95% confidence interval for the beta for Nike is (lower) and (upper) (Round to two decimal places.) The 95% confidence interval for the beta for HP is (lower) and (upper) (Round to two decimal places.) \begin{tabular}{crrrr} Date & Risk-free Rate & \multicolumn{1}{c}{ NKE } & \multicolumn{1}{c}{ HPQ } & S\&P 500 \\ \hline Jan-11 & 0.145% & 3.442% & 8.527% & 2.330% \\ Feb-11 & 0.135% & 7.941% & 4.509% & 3.474% \\ Mar-11 & 0.090% & 13.580% & 5.693% & 0.005% \\ Apr-11 & 0.040% & 8.745% & 1.464% & 2.896% \\ May-11 & 0.040% & 2.587% & 7.406% & 1.121% \\ Jun-11 & 0.015% & 8.017% & 1.915% & 1.706% \\ Jul-11 & 0.090% & 0.189% & 3.379% & 2.000% \\ Aug-11 & 0.015% & 3.882% & 25.988% & 5.498% \\ Sep-11 & 0.010% & 0.115% & 12.738% & 6.910% \\ Oct-11 & 0.005% & 12.677% & 18.530% & 10.915% \\ Nov-11 & 0.015% & 0.176% & 5.036% & 0.406% \\ Dec-11 & 0.005% & 1.695% & 6.890% & 1.024% \\ Jan-12 & 0.055% & 7.907% & 8.618% & 4.637% \\ Feb-12 & 0.075% & 3.779% & 9.543% & 4.341% \\ Mar-12 & 0.065% & 1.816% & 4.803% & 3.214% \\ Apr-12 & 0.090% & 3.163% & 3.903% & 0.668% \\ May-12 & 0.060% & 2.011% & 8.401% & 6.006% \\ Jun-12 & 0.080% & 18.857% & 10.050% & 4.045% \\ Jul-12 & 0.100% & 6.345% & 9.299% & 1.183% \\ Aug-12 & 0.085% & 5.838% & 7.456% & 2.505% \end{tabular} \begin{tabular}{crrrr} Jun-16 & 0.248% & 0.254% & 5.277% & 0.342% \\ Jul-16 & 0.240% & 0.543% & 11.633% & 3.647% \\ Aug-16 & 0.320% & 3.856% & 2.570% & 0.120% \\ Sep-16 & 0.260% & 8.380% & 8.935% & 0.001% \\ Oct-16 & 0.295% & 4.691% & 6.697% & 1.734% \\ Nov-16 & 0.468% & 0.219% & 6.280% & 3.684% \\ Dec-16 & 0.480% & 1.877% & 2.775% & 2.032% \\ Jan-17 & 0.500% & 4.072% & 1.415% & 1.789% \\ Feb-17 & 0.523% & 8.053% & 15.415% & 3.929% \\ Mar-17 & 0.738% & 2.187% & 3.700% & 0.128% \\ Apr-17 & 0.780% & 0.574% & 5.257% & 0.993% \\ May-17 & 0.950% & 4.367% & 0.319% & 1.411% \\ Jun-17 & 0.993% & 11.681% & 6.116% & 0.639% \\ Jul-17 & 1.053% & 0.085% & 9.268% & 2.055% \\ Aug-17 & 0.978% & 10.262% & 0.105% & 0.292% \\ Sep-17 & 1.028% & 1.818% & 5.308% & 2.010% \\ Oct-17 & 1.123% & 6.056% & 7.966% & 2.356% \\ Nov-17 & 1.238% & 9.875% & 0.464% & 3.057% \\ Dec-17 & 1.355% & 3.856% & 1.402% & 1.208% \\ \hline \end{tabular} Sep-12Oct-12Nov-12Dec-12Jan-13Feb-13Mar-13Apr-13May-13Jun-13Jul-13Aug-13Sep-13Oct-13Nov-13Dec-13Jan-14Feb-14Mar-14Apr-14May-14Jun-140.090%0.105%0.075%0.035%0.065%0.100%0.065%0.045%0.030%0.030%0.030%0.020%0.005%0.033%0.055%0.063%0.010%0.043%0.028%0.020%0.030%0.020%2.516%3.719%6.675%7.591%4.748%1.536%8.355%7.778%2.390%3.276%1.193%0.509%15.632%4.295%4.461%0.025%7.363%8.140%5.671%1.232%6.086%0.832%2.788%18.816%6.209%11.937%15.860%21.987%19.815%13.591%18.544%2.865%3.548%13.006%4.612%16.103%12.228%3.473%3.645%3.034%9.370%2.163%1.331%1.589%2.543%1.820%0.566%0.902%5.119%1.276%3.795%1.921%2.361%1.340%5.168%2.999%3.176%4.631%2.964%2.580%3.525%4.552%0.829%0.695%2.321%2.064% Use the data table, , to estimate the 95% confidence interval for the alpha and beta of Nike (NKE) and HP (HPQ) stock using Excel's regression tool (from the data analysis menu) or the linest() function. The 95% confidence interval for the alpha for Nike is (lower) \% and (upper) \%. (Round to two decimal places.) The 95% confidence interval for the alpha for HP is (lower) \% and (upper) \%. (Round to two decimal places.) The 95% confidence interval for the beta for Nike is (lower) and (upper) (Round to two decimal places.) The 95% confidence interval for the beta for HP is (lower) and (upper) (Round to two decimal places.) \begin{tabular}{crrrr} Date & Risk-free Rate & \multicolumn{1}{c}{ NKE } & \multicolumn{1}{c}{ HPQ } & S\&P 500 \\ \hline Jan-11 & 0.145% & 3.442% & 8.527% & 2.330% \\ Feb-11 & 0.135% & 7.941% & 4.509% & 3.474% \\ Mar-11 & 0.090% & 13.580% & 5.693% & 0.005% \\ Apr-11 & 0.040% & 8.745% & 1.464% & 2.896% \\ May-11 & 0.040% & 2.587% & 7.406% & 1.121% \\ Jun-11 & 0.015% & 8.017% & 1.915% & 1.706% \\ Jul-11 & 0.090% & 0.189% & 3.379% & 2.000% \\ Aug-11 & 0.015% & 3.882% & 25.988% & 5.498% \\ Sep-11 & 0.010% & 0.115% & 12.738% & 6.910% \\ Oct-11 & 0.005% & 12.677% & 18.530% & 10.915% \\ Nov-11 & 0.015% & 0.176% & 5.036% & 0.406% \\ Dec-11 & 0.005% & 1.695% & 6.890% & 1.024% \\ Jan-12 & 0.055% & 7.907% & 8.618% & 4.637% \\ Feb-12 & 0.075% & 3.779% & 9.543% & 4.341% \\ Mar-12 & 0.065% & 1.816% & 4.803% & 3.214% \\ Apr-12 & 0.090% & 3.163% & 3.903% & 0.668% \\ May-12 & 0.060% & 2.011% & 8.401% & 6.006% \\ Jun-12 & 0.080% & 18.857% & 10.050% & 4.045% \\ Jul-12 & 0.100% & 6.345% & 9.299% & 1.183% \\ Aug-12 & 0.085% & 5.838% & 7.456% & 2.505% \end{tabular} \begin{tabular}{crrrr} Jun-16 & 0.248% & 0.254% & 5.277% & 0.342% \\ Jul-16 & 0.240% & 0.543% & 11.633% & 3.647% \\ Aug-16 & 0.320% & 3.856% & 2.570% & 0.120% \\ Sep-16 & 0.260% & 8.380% & 8.935% & 0.001% \\ Oct-16 & 0.295% & 4.691% & 6.697% & 1.734% \\ Nov-16 & 0.468% & 0.219% & 6.280% & 3.684% \\ Dec-16 & 0.480% & 1.877% & 2.775% & 2.032% \\ Jan-17 & 0.500% & 4.072% & 1.415% & 1.789% \\ Feb-17 & 0.523% & 8.053% & 15.415% & 3.929% \\ Mar-17 & 0.738% & 2.187% & 3.700% & 0.128% \\ Apr-17 & 0.780% & 0.574% & 5.257% & 0.993% \\ May-17 & 0.950% & 4.367% & 0.319% & 1.411% \\ Jun-17 & 0.993% & 11.681% & 6.116% & 0.639% \\ Jul-17 & 1.053% & 0.085% & 9.268% & 2.055% \\ Aug-17 & 0.978% & 10.262% & 0.105% & 0.292% \\ Sep-17 & 1.028% & 1.818% & 5.308% & 2.010% \\ Oct-17 & 1.123% & 6.056% & 7.966% & 2.356% \\ Nov-17 & 1.238% & 9.875% & 0.464% & 3.057% \\ Dec-17 & 1.355% & 3.856% & 1.402% & 1.208% \\ \hline \end{tabular}