Answered step by step
Verified Expert Solution
Question
1 Approved Answer
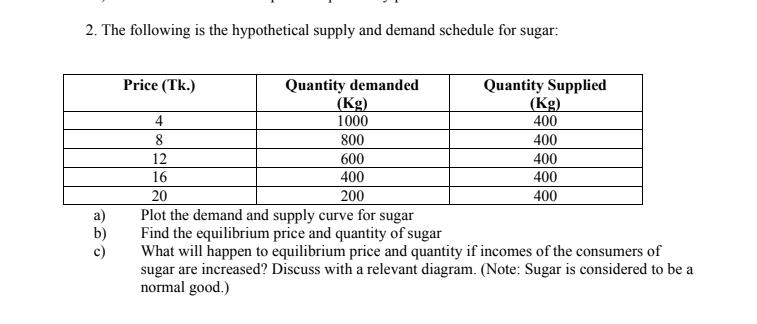
2. The following is the hypothetical supply and demand schedule for sugar: b) c) Price (Tk.) 4 8 Quantity demanded (Kg) 1000 800 600

2. The following is the hypothetical supply and demand schedule for sugar: b) c) Price (Tk.) 4 8 Quantity demanded (Kg) 1000 800 600 400 200 Quantity Supplied (Kg) 400 400 400 400 400 12 16 20 Plot the demand and supply curve for sugar Find the equilibrium price and quantity of sugar What will happen to equilibrium price and quantity if incomes of the consumers of sugar are increased? Discuss with a relevant diagram. (Note: Sugar is considered to be a normal good.)
Step by Step Solution
★★★★★
3.46 Rating (162 Votes )
There are 3 Steps involved in it
Step: 1
a b Equilibrium Price 16 Tk Equilibrium Quantity 400 Kg c If the income of the con...
Get Instant Access to Expert-Tailored Solutions
See step-by-step solutions with expert insights and AI powered tools for academic success
Step: 2

Step: 3

Ace Your Homework with AI
Get the answers you need in no time with our AI-driven, step-by-step assistance
Get Started


