
Set all variables to their baseline values.1) How much spaghetti is supplied when its price is $20 per plate?2) How much is supplied when price is $10 per plate?Set all variables to their baseline values.3) When the price of spaghetti is $10 per plate, how much total revenue from sales doproducers expect?Set all variables at their baseline values.4) When the price of spaghetti is $15 per plate, how much total revenue from sales doproducers expect? [Compare your answer to the answer to 3).]5) Set all variables to their baseline values. With the price of spaghetti at $12, how muchdoes supply change when the wage rate (price of labor) rises to $8.00?6) Set all variables to their baseline values and set the price of spaghetti to $12. Increase theprice of sauce to $7 per unit. Does the supply of spaghetti increase or decrease?7) Based on the analysis of the previous question, by how much did the supply of spaghettichange when the price of sauce increased from $3 to $7 per unit?8) Set all variables to their baseline values, and set the price of spaghetti to $12. If a tax of$5 per unit is placed on all spaghetti sales, how much does supply change?9) Set all variables to their baseline values, and set the price of spaghetti to $6. If a tax of $5per unit is placed on all spaghetti sales, how much does supply change?10) Set all variables to their baseline values, and set the price of spaghetti to $12. If a subsidyof $2 per plate is paid to sellers, how much does supply change?11) Set all variables to their baseline values. With a subsidy of $5 per plate, what would theprice of spaghetti have to be to make supply equal to 4,000?12) Set all variables to their baseline values, and set the price of spaghetti to $8. What wouldthe price of labor (wage rate) have to be to make supply equal to 2,500?"Set all variables to their baseline values, and set the price of spaghetti to $10. Now set to tax to$5.13) By how much must the price of spaghetti rise to keep spaghetti supply at its pre-tax level?
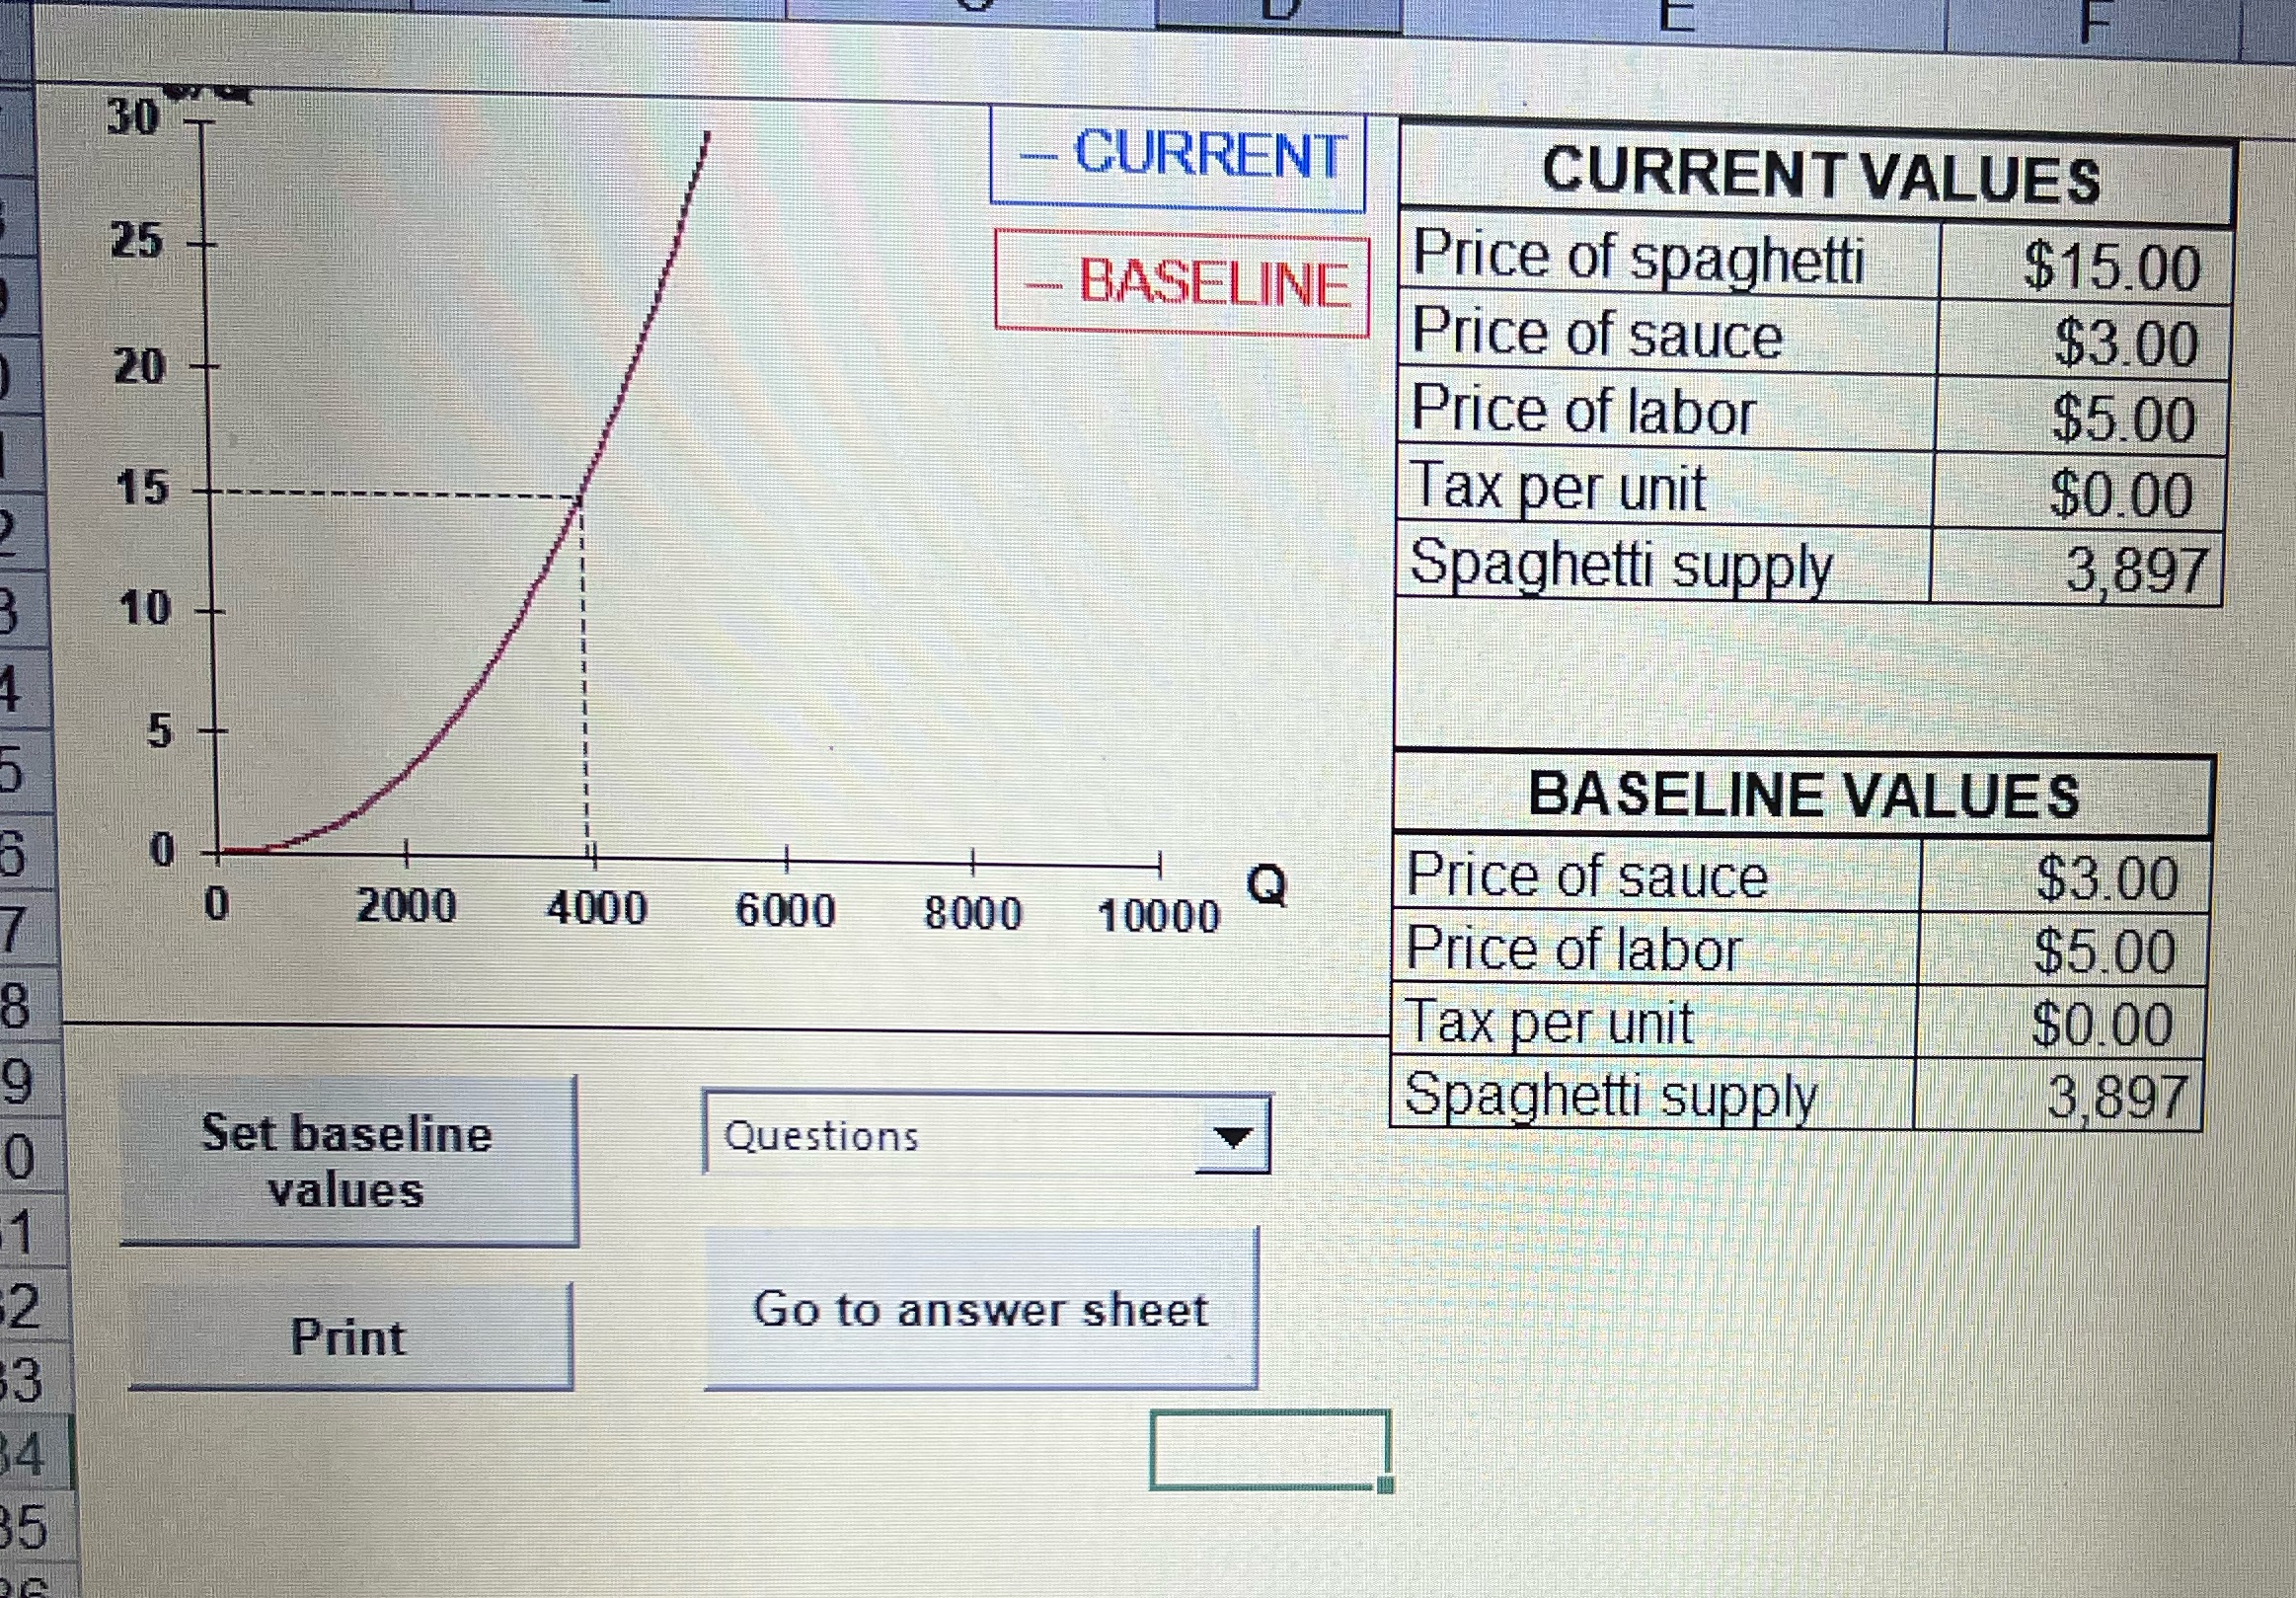
30 CURRENT CURRENT VALUES 25 BASELINE Price of spaghetti $15.00 Price of sauce $3.00 20 Price of labor $5.00 15 Tax per unit $0.00 Spaghetti supply 3,897 10 5 BASELINE VALUES 0 Price of sauce 2000 4000 10000 Q $3.00 6000 8000 Price of labor $5.00 Tax per unit $0.00 Spaghetti supply 3,897 o0 Set baseline Questions values 2 Go to answer sheet Print 3 14 $53 SUPPLY FUNCTIONS AND SUPPLY CURVES Purpose: To emphasize the distinction between movements along supply curves and shifts of supply curves. To show, using graphs, how to compute quantities supplied. To show the effects of a per unit tax on supply. Computer file: supply98.xls Instructions and background information: Open the Excel file supply98.xIs, and choose whether you want to do the problems as practice, or whether you want to do the problems to hand in for credit. The supply of any good is the amount producers or firms want to sell and are able to sell in a time period. The basic model of supply assumes that the amount supplied depends on the good's own price, the prices of inputs used in its production, the technology of production, certain kinds of taxes, and perhaps other factors. In this example, the spreadsheet shows a hypothetical supply curve for spaghetti in San Francisco, measured in plates served per day. Supply depends on the price of spaghetti, the prices of two inputs, labor and sauce, and the amount of a per unit tax placed on production and sale. A per unit tax is an amount producers must pay the government for each unit of output sold. The producer's total tax bill is found by multiplying the tax per unit times the number of units sold. You can change all of the variables and spaghetti supply will be updated. The graph of the supply curve will be redrawn to show the effects of your changes. Experiment with the worksheet by changing the current values of prices, and the tax rate and seeing the effects on quantity supplied and on the graph of the supply curve. The answers to all of the questions can be found by using trial and error. Excel, however, provides you with a shortcut that can make finding the answers a lot quicker and easier -- Goal Seek. The Goal Seek program can be found under the Tools menu in Excel. You can use it here, for example, to find the value of a per unit tax that will make the amount of spaghetti supplied equal to a prespecified amount. Or you can use it to find the price of spaghetti that will make the amount supplied equal to a given amount, say 4,000 plates per day. You can find help in using Goal Seek in the introductory section to these problems. Here are some things to watch for and learn as you do the problems:1) Only changes in a good's own price move firms along the supply curve for spaghetti. 2) Changes in all of the other factors affecting supply (price of sauce, the per unit tax, etc.) make the supply curve shift. 3) Changes in input prices change supply more at higher spaghetti prices. The supply curve seems to pivot at the origin. 4) Changes in the per unit tax shift the supply curve up by the amount of the tax along the entire length of the curve. Negative taxes are called subsidies, and shift the supply curve down by the amount of the subsidy. Government can manipulate the amount of spaghetti offered for sale by changing the amount of the tax or subsidy. Here are some hints to help you get the answers quicker: 1) Always be sure to set variables such as input prices and the tax rate to their baseline values when you are asked to do so. When the spreadsheet computes its own version of the answers it assumes you have done this. 2) Be sensitive to the signs (+ or -) on you answers when you're asked for the change in a variable. Decreases must carry the minus sign to be recognized as correct. 3) If the answer is a word instead of a number, always use lower case letters. Check the Answer Bin for alternatives, and Copy items from the Bin and Paste them on the Answer Sheet it you want. MATH MAVEN'S CORNER: The supply function for spaghetti is given by Q(S) = M(p, -1)" PieceW, where Ps is the price of spaghetti, Psauce is the price of sauce, w is the price of labor (the wage rate), and t is the tax per unit of spaghetti. The parameters M, n, q, and r vary randomly from problem to