Answered step by step
Verified Expert Solution
Link Copied!

Question

1 Approved Answer

SET Topic: Residuals, residual plots and correlation coefficients The data sheets in exercise 5 and exercise 6 are scatter plots that have the regression line
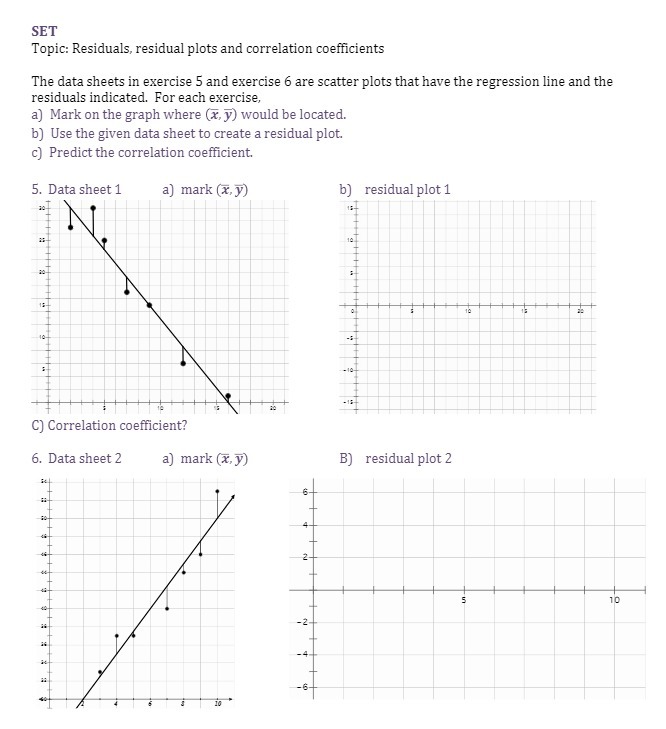
image text in transcribed
SET Topic: Residuals, residual plots and correlation coefficients The data sheets in exercise 5 and exercise 6 are scatter plots that have the regression line and the residuals indicated. For each exercise, a) Mark on the graph where (x, y) would be located. b) Use the given data sheet to create a residual plot. c) Predict the correlation coefficient. 5. Data sheet 1 a) mark (x, y) b) residual plot 1 N C) Correlation coefficient? 6. Data sheet 2 a) mark (x, y) B) residual plot 2 6- In - 10 -2- -4

Step by Step Solution

There are 3 Steps involved in it

Step: 1

blur-text-image

Get Instant Access to Expert-Tailored Solutions

See step-by-step solutions with expert insights and AI powered tools for academic success

Step: 2

blur-text-image_2

Step: 3

blur-text-image_3

Ace Your Homework with AI

Get the answers you need in no time with our AI-driven, step-by-step assistance

Get Started

Recommended Textbook for

An Introduction to the Mathematics of financial Derivatives

Authors: Salih N. Neftci

2nd Edition

978-0125153928, 9780080478647, 125153929, 978-0123846822

More Books

Students also viewed these Mathematics questions

Question

What is the purpose of organizational control? Why is it important?

Answered: 1 week ago

Question

9. Why do many firms strive to maintain stable prices? LO26.5

Answered: 1 week ago