

Question
Several studies have found that the frequency with which shoppers browse internet retailers is related to the frequency with which they actually purchase products and/or
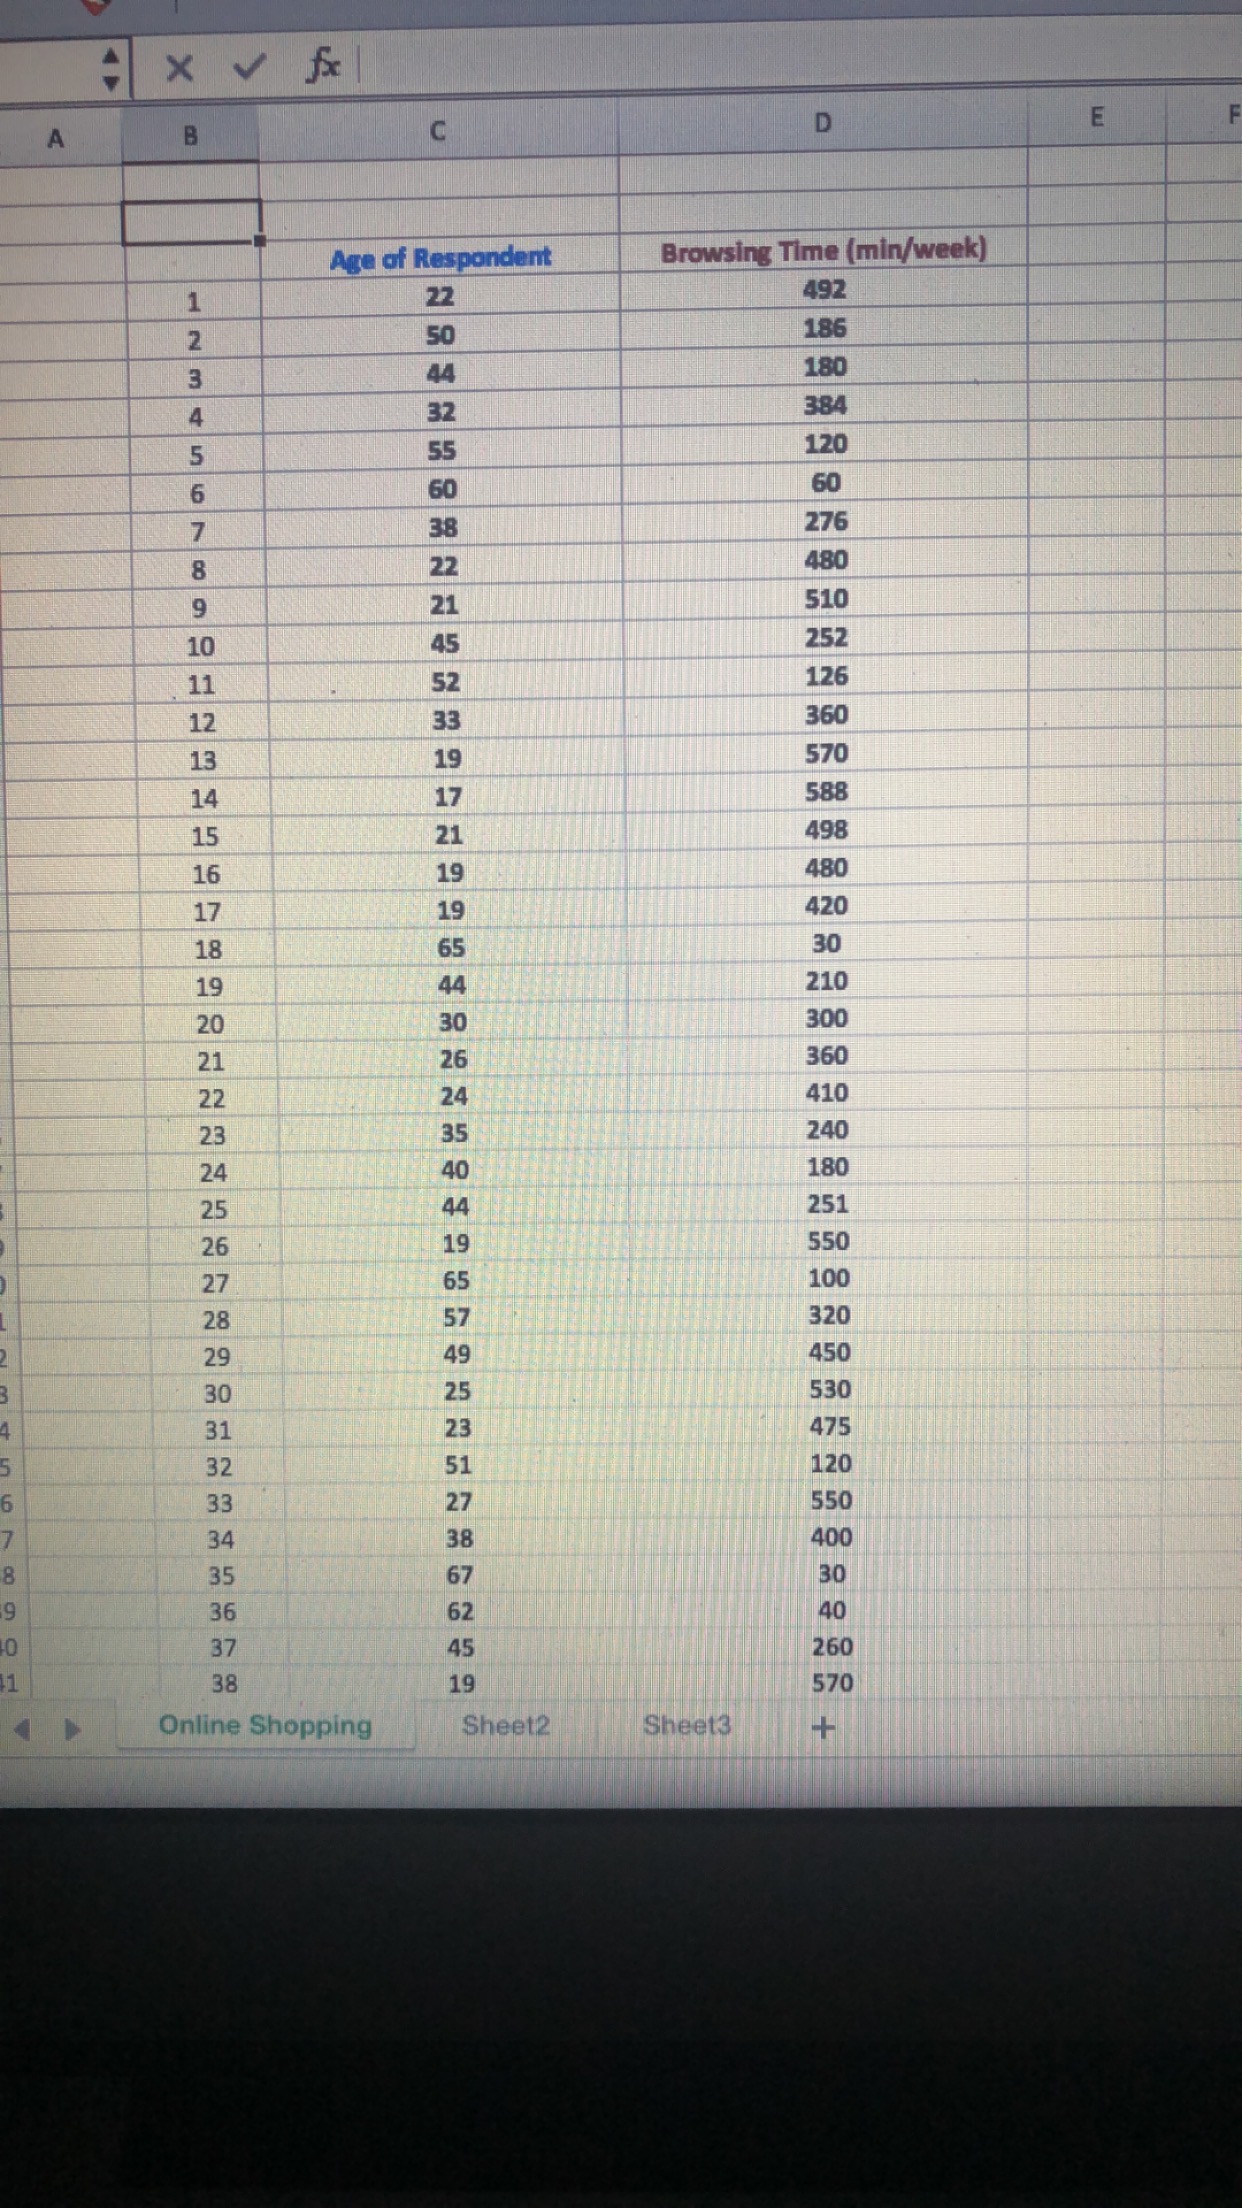
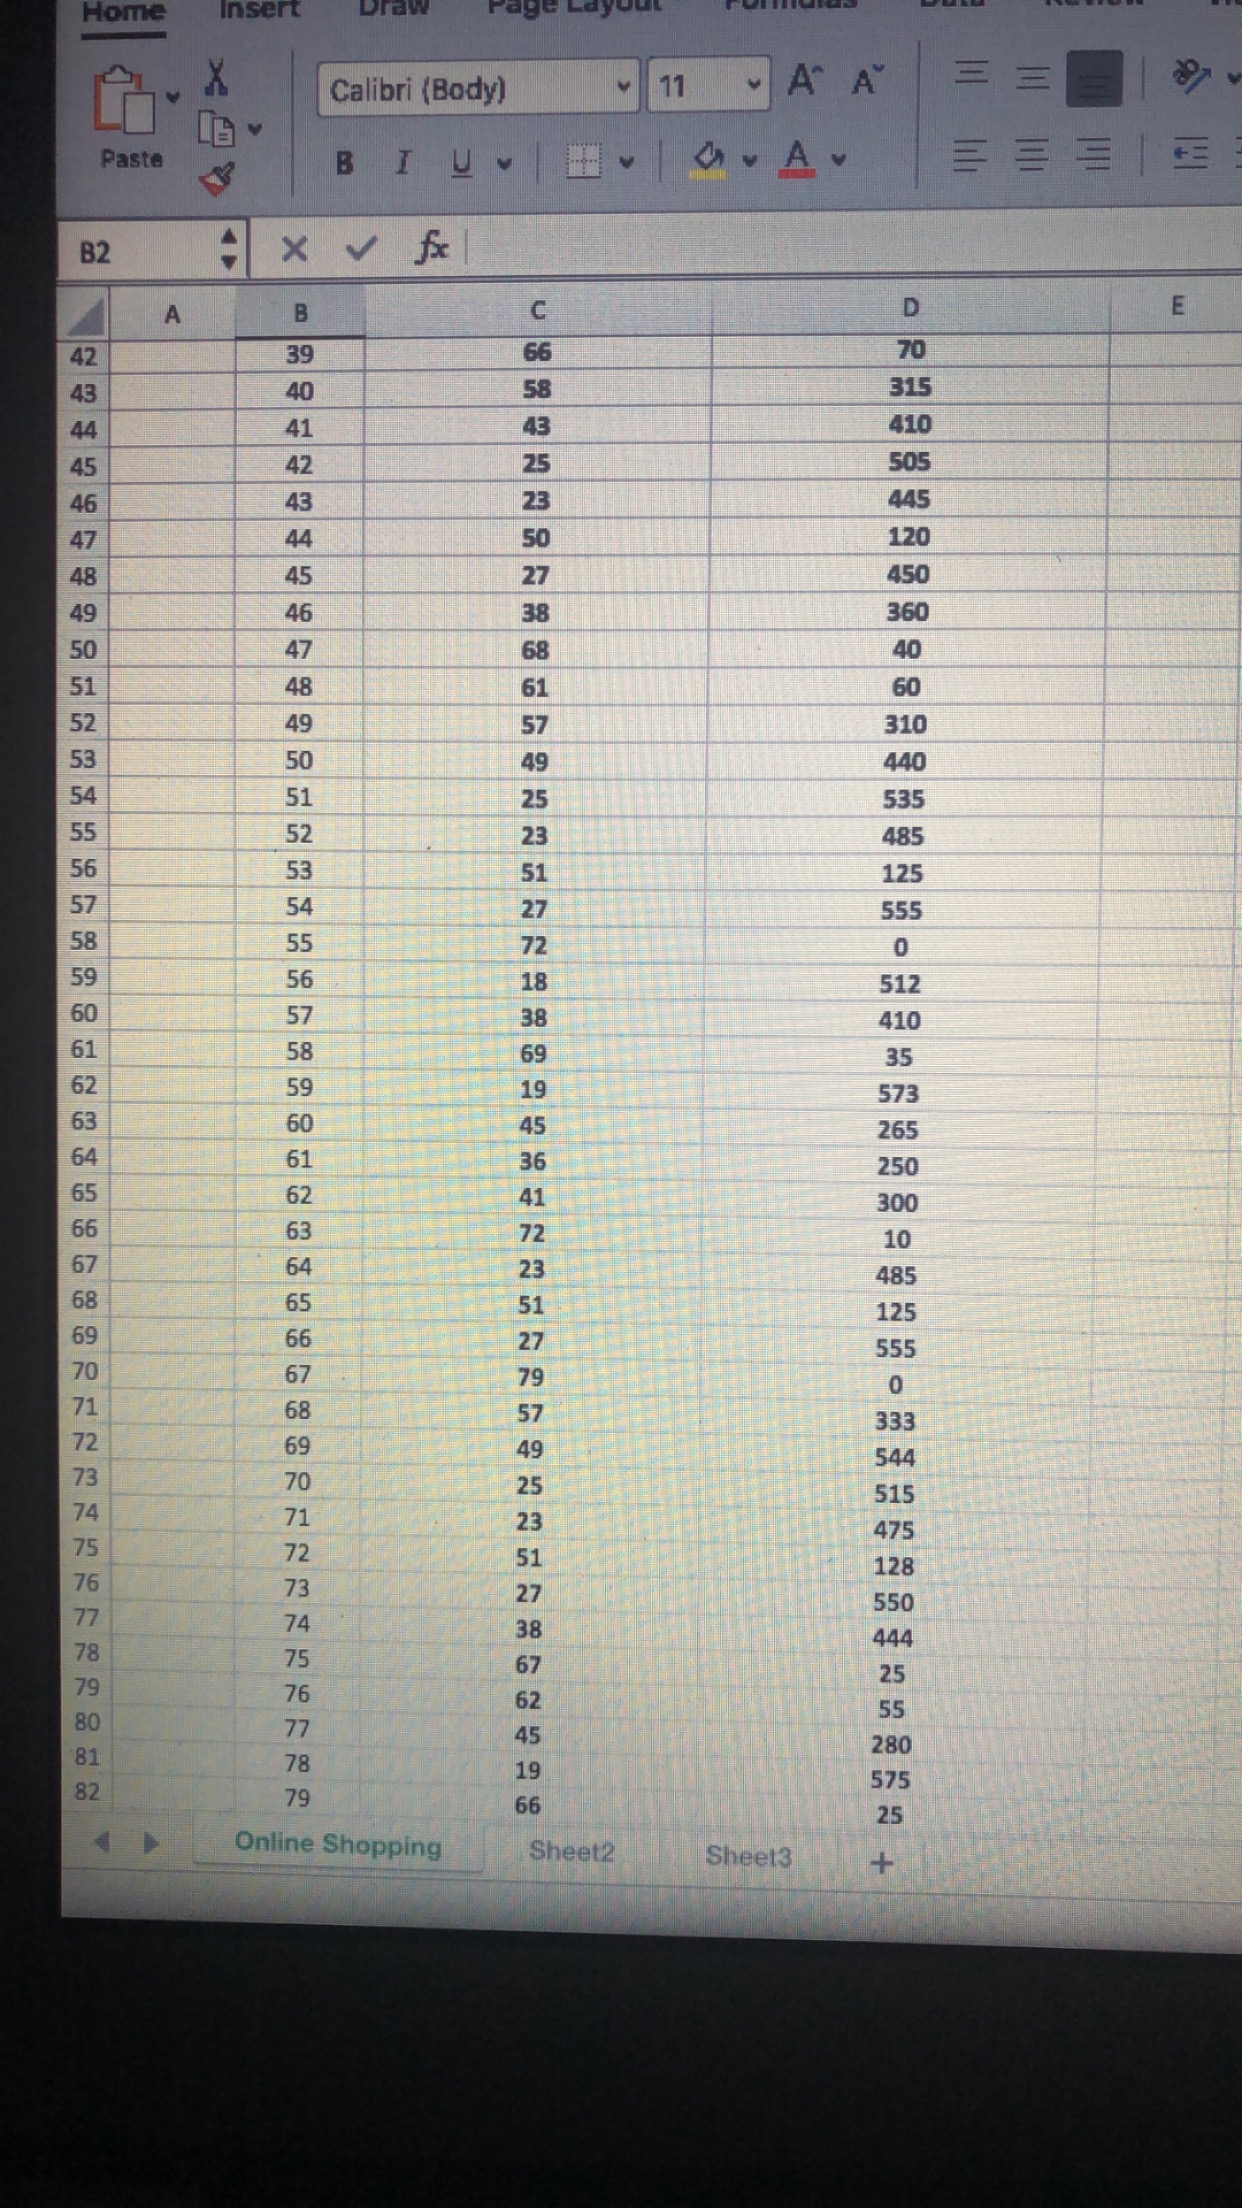
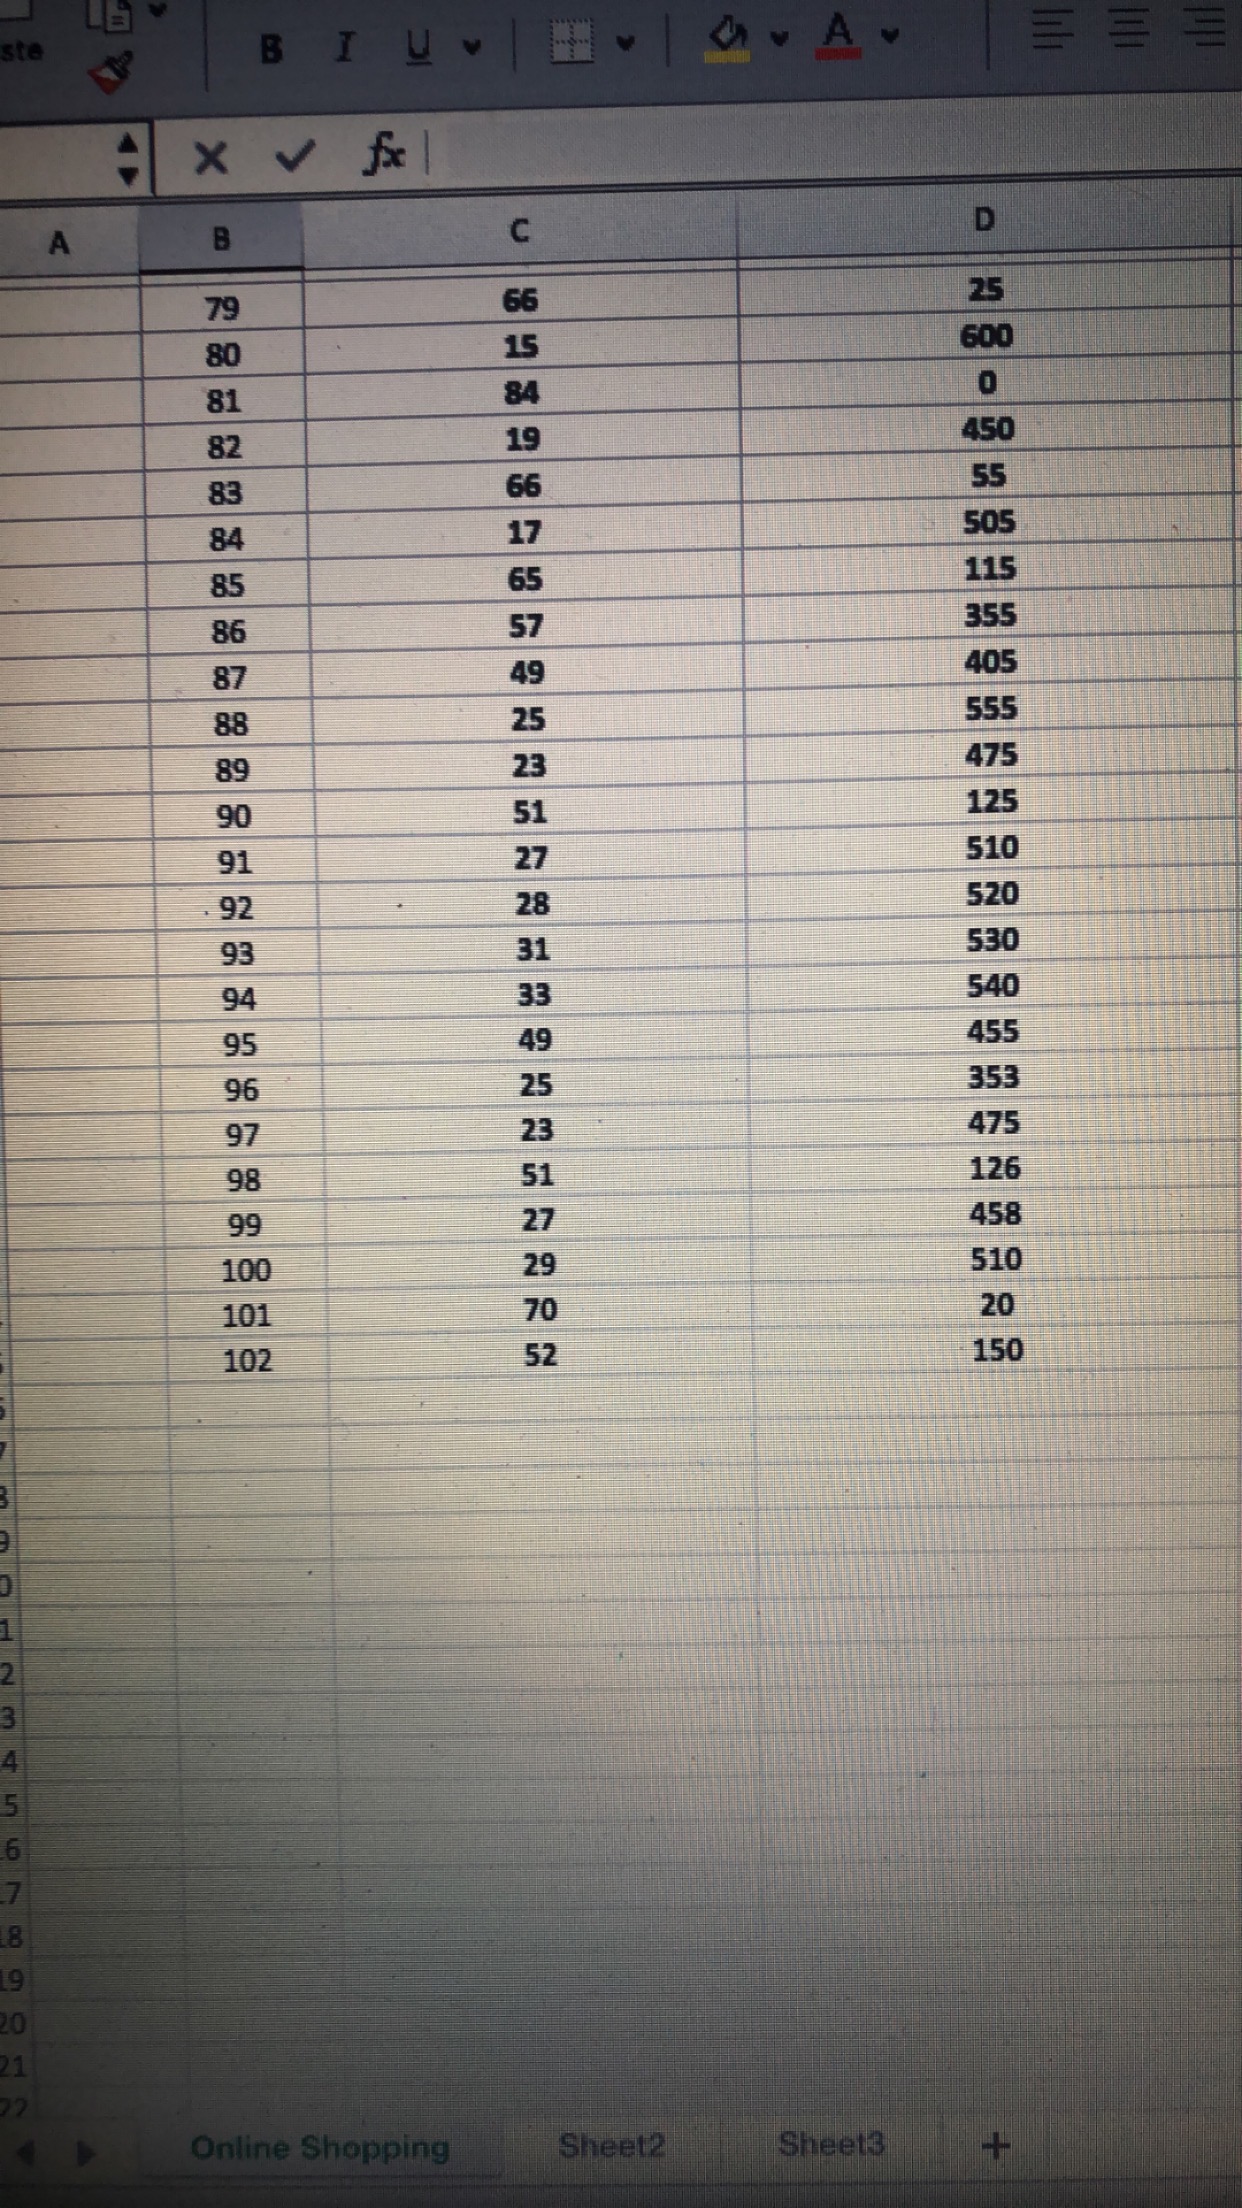
Several studies have found that the frequency with which shoppers browse internet retailers is related to the frequency with which they actually purchase products and/or services online. the data collected by Humber Business School students show the age of 100 respondents and their answer to the question, "how many minutes do you browse online retailers per week?" The students want to find out whether variables the age of respondents (years) and the browsing time (min/week) are linearly related to each other. If they are, then how strongly the browsing time depends on the age of respondents. Please complete the following tasks using Excel.
a. Construct a scatter diagram for the age of respondents and the browsing time. Do not forget to label the axis. Does it seem that the variables are linearly correlated?
b. Find and interpret the coefficient of correlation, r. Find and interpret the coefficient of determination, r 2 .
c. Find the regression equation and plot the regression line. Interpret the slope of the regression line. Can we interpret the y-intercept? Why?
d. Humber students consider a group of 5 typical on-line shoppers. Their ages are 29, 36, 47, 54, and 65 years. Using the regression equation find for each of them the most likely browsing time per week in minutes.
HINT: Watch the following video https://youtu.be/C4yDsm9rsiY
Step by Step Solution
There are 3 Steps involved in it
Step: 1

Get Instant Access to Expert-Tailored Solutions
See step-by-step solutions with expert insights and AI powered tools for academic success
Step: 2

Step: 3
Ace Your Homework with AI
Get the answers you need in no time with our AI-driven, step-by-step assistance
Get Started
Probability With Applications and R
Authors: Robert P. Dobrow
1st edition
1118241257, 1118241258, 978-1118241257