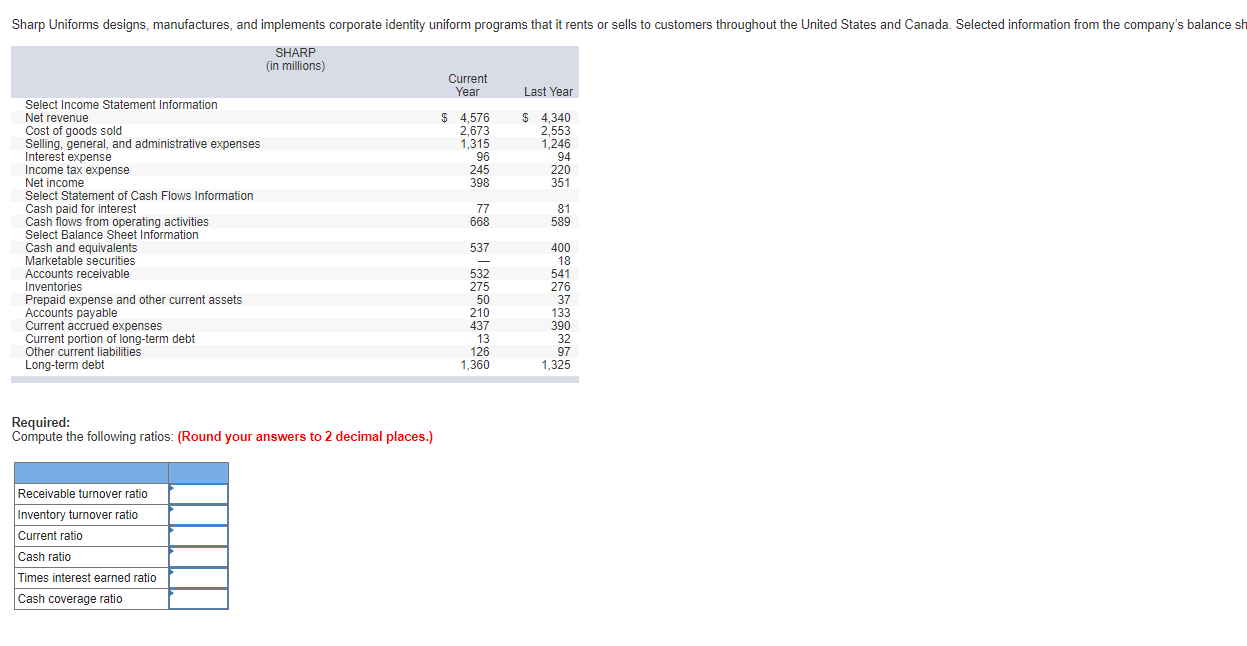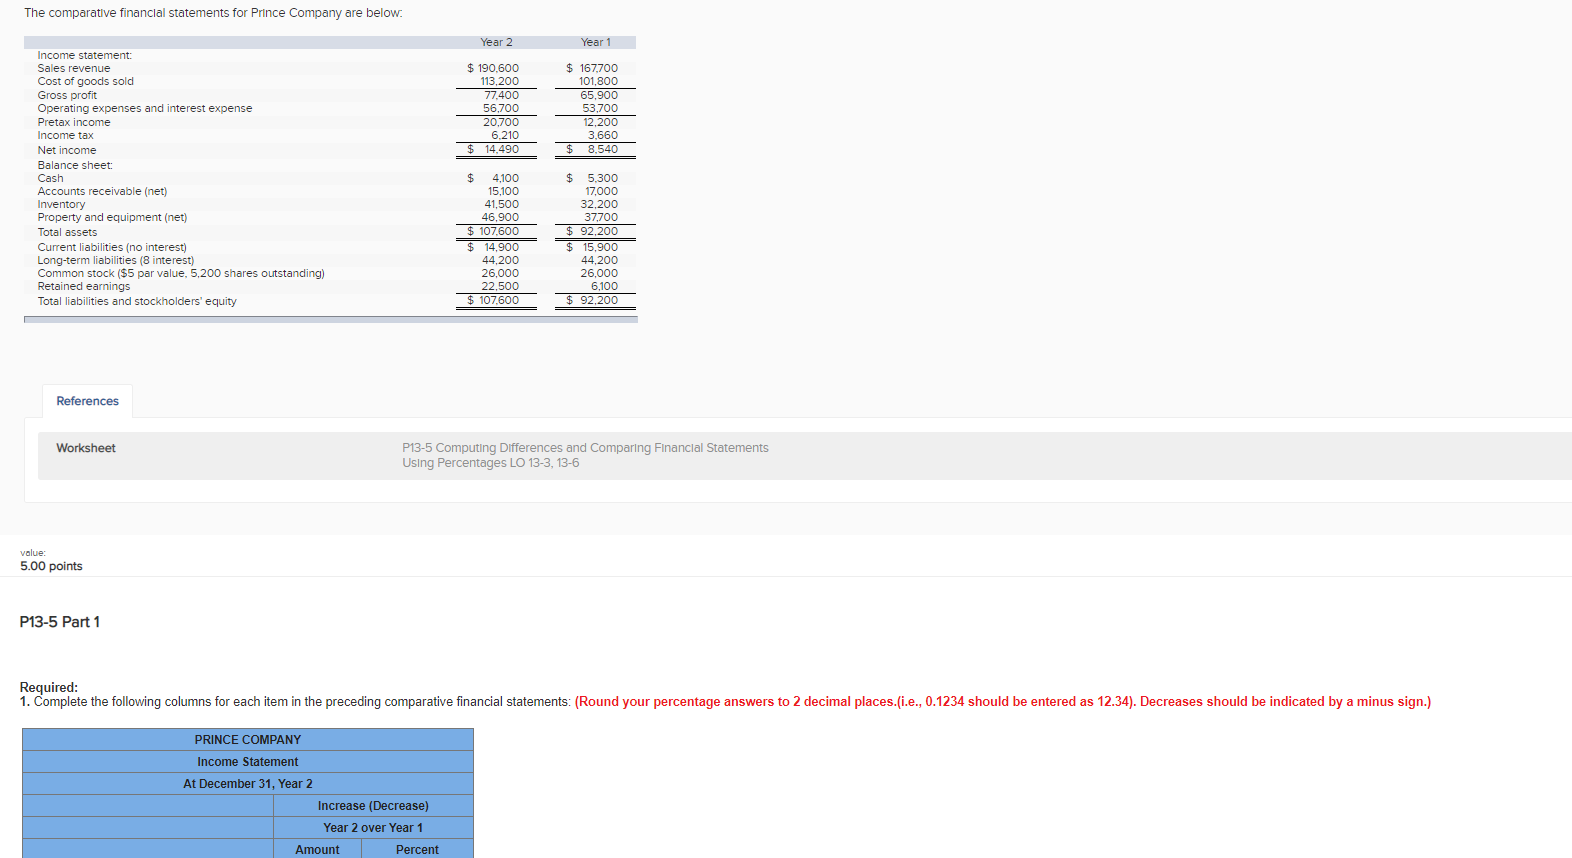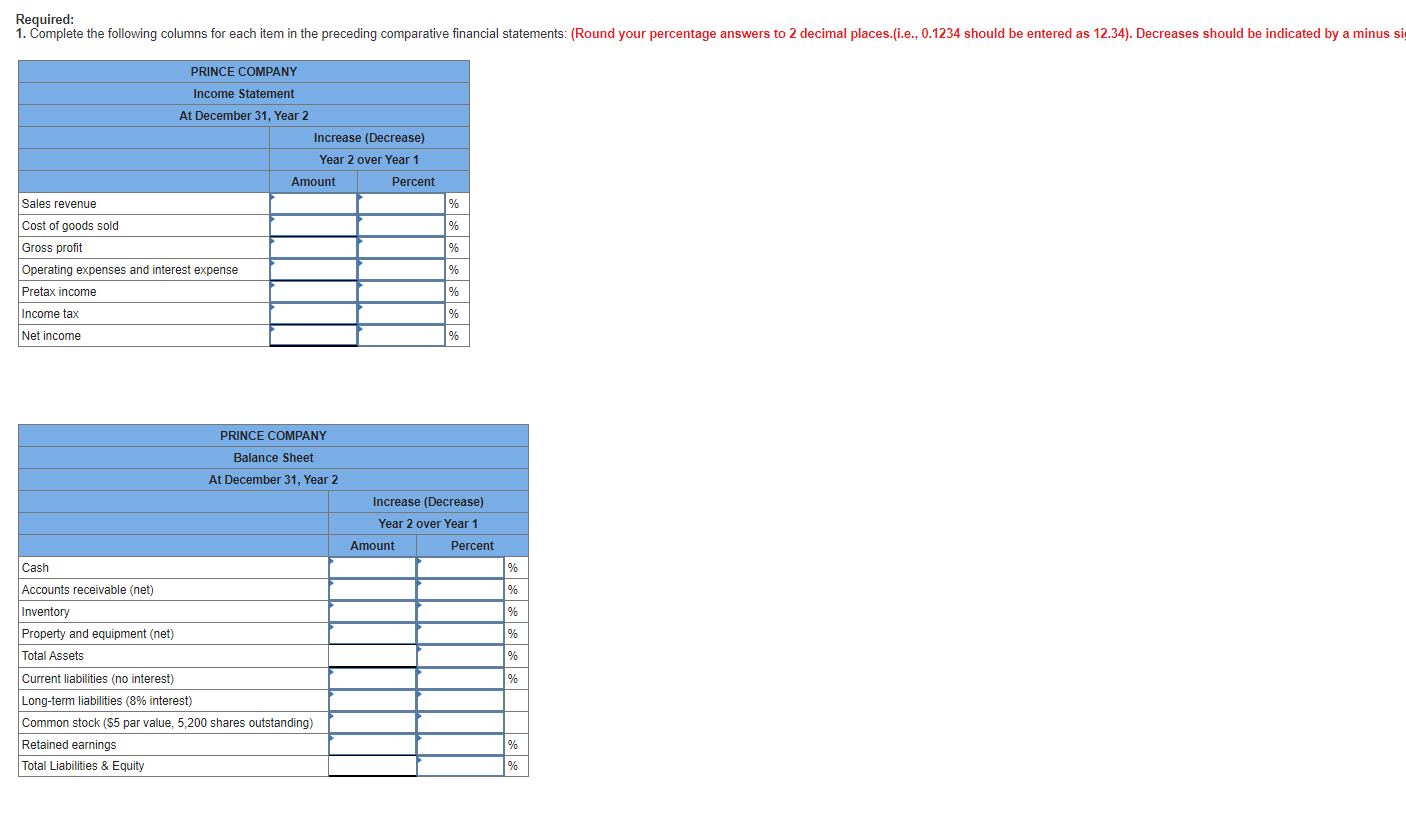


Sharp Uniforms designs, manufactures, and implements corporate identity uniform programs that it rents or sells to customers throughout the United States and Canada. Selected information from the company's balance sh SHARP (in millions) Current Year Last Year $ 4,576 2,673 1,315 96 245 398 $ 4,340 2,553 1,246 94 220 351 77 668 81 589 Select Income Statement Information Net revenue Cost of goods sold Selling, general, and administrative expenses Interest expense Income tax expense Net income Select Statement of Cash Flows Information Cash paid for interest Cash flows from operating activities Select Balance Sheet Information Cash and equivalents Marketable securities Accounts receivable Inventories Prepaid expense and other current assets Accounts payable Current accrued expenses Current portion of long-term debt Other current liabilities Long-term debt 537 532 275 50 210 437 13 126 1,360 400 18 541 276 37 133 390 32 97 1,325 Required: Compute the following ratios: (Round your answers to 2 decimal places.) Receivable turnover ratio Inventory turnover ratio Current ratio Cash ratio Times interest earned ratio Cash coverage ratio The comparative financial statements for Prince Company are below. Year 2 Year 1 $ 190,600 113,200 77.400 56,700 20,700 6.210 $ 14,490 $ 167.700 101,800 65,900 53.700 12,200 3.660 $ 8.540 Income statement: Sales revenue Cost of goods sold Gross profit Operating expenses and interest expense Pretax income Income tax Net income Balance sheet: Cash Accounts receivable (net) Inventory Property and equipment (net) Total assets Current liabilities (no interest) Long-term liabilities (8 interest) Common stock ($5 par value, 5,200 shares outstanding) Retained earnings Total liabilities and stockholders' equity $ 4,100 15,100 41,500 46.900 107.600 $ 14,900 44,200 26,000 22,500 $ 107,600 $ 5.300 17,000 32.200 37,700 $ 92,200 $ 15,900 44,200 26,000 6,100 $ 92,200 References Worksheet P13-5 Computing Differences and Comparing Financial Statements Using Percentages LO 13-3, 13-6 value: 5.00 points P13-5 Part 1 Required: 1. Complete the following columns for each item in the preceding comparative financial statements: (Round your percentage answers to 2 decimal places.(i.e., 0.1234 should be entered as 12.34). Decreases should be indicated by a minus sign.) PRINCE COMPANY Income Statement At December 31, Year 2 Increase (Decrease) Year 2 over Year 1 Amount Percent Required: 1. Complete the following columns for each item in the preceding comparative financial statements: (Round your percentage answers to 2 decimal places.(i.e., 0.1234 should be entered as 12.34). Decreases should be indicated by a minus si PRINCE COMPANY Income Statement At December 31, Year 2 Increase (Decrease) Year 2 over Year 1 Amount Percent % % Sales revenue Cost of goods sold Gross profit Operating expenses and interest expense Pretax income % % % Income tax % % Net income PRINCE COMPANY Balance Sheet At December 31, Year 2 Increase (Decrease) Year 2 over Year 1 Amount Percent Cash % % % % % Accounts receivable (net) Inventory Property and equipment (net) Total Assets Current liabilities (no interest) Long-term liabilities (8% interest) Common stock ($5 par value, 5,200 shares outstanding) Retained earnings Total Liabilities Equity % % % value 5.00 points P13-5 Part 2 2. By what amount did the current ratio change? (Round your intermediate calculations and final answer to 2 decimal places.) Current ratio change Sharp Uniforms designs, manufactures, and implements corporate identity uniform programs that it rents or sells to customers throughout the United States and Canada. Selected information from the company's balance sh SHARP (in millions) Current Year Last Year $ 4,576 2,673 1,315 96 245 398 $ 4,340 2,553 1,246 94 220 351 77 668 81 589 Select Income Statement Information Net revenue Cost of goods sold Selling, general, and administrative expenses Interest expense Income tax expense Net income Select Statement of Cash Flows Information Cash paid for interest Cash flows from operating activities Select Balance Sheet Information Cash and equivalents Marketable securities Accounts receivable Inventories Prepaid expense and other current assets Accounts payable Current accrued expenses Current portion of long-term debt Other current liabilities Long-term debt 537 532 275 50 210 437 13 126 1,360 400 18 541 276 37 133 390 32 97 1,325 Required: Compute the following ratios: (Round your answers to 2 decimal places.) Receivable turnover ratio Inventory turnover ratio Current ratio Cash ratio Times interest earned ratio Cash coverage ratio The comparative financial statements for Prince Company are below. Year 2 Year 1 $ 190,600 113,200 77.400 56,700 20,700 6.210 $ 14,490 $ 167.700 101,800 65,900 53.700 12,200 3.660 $ 8.540 Income statement: Sales revenue Cost of goods sold Gross profit Operating expenses and interest expense Pretax income Income tax Net income Balance sheet: Cash Accounts receivable (net) Inventory Property and equipment (net) Total assets Current liabilities (no interest) Long-term liabilities (8 interest) Common stock ($5 par value, 5,200 shares outstanding) Retained earnings Total liabilities and stockholders' equity $ 4,100 15,100 41,500 46.900 107.600 $ 14,900 44,200 26,000 22,500 $ 107,600 $ 5.300 17,000 32.200 37,700 $ 92,200 $ 15,900 44,200 26,000 6,100 $ 92,200 References Worksheet P13-5 Computing Differences and Comparing Financial Statements Using Percentages LO 13-3, 13-6 value: 5.00 points P13-5 Part 1 Required: 1. Complete the following columns for each item in the preceding comparative financial statements: (Round your percentage answers to 2 decimal places.(i.e., 0.1234 should be entered as 12.34). Decreases should be indicated by a minus sign.) PRINCE COMPANY Income Statement At December 31, Year 2 Increase (Decrease) Year 2 over Year 1 Amount Percent Required: 1. Complete the following columns for each item in the preceding comparative financial statements: (Round your percentage answers to 2 decimal places.(i.e., 0.1234 should be entered as 12.34). Decreases should be indicated by a minus si PRINCE COMPANY Income Statement At December 31, Year 2 Increase (Decrease) Year 2 over Year 1 Amount Percent % % Sales revenue Cost of goods sold Gross profit Operating expenses and interest expense Pretax income % % % Income tax % % Net income PRINCE COMPANY Balance Sheet At December 31, Year 2 Increase (Decrease) Year 2 over Year 1 Amount Percent Cash % % % % % Accounts receivable (net) Inventory Property and equipment (net) Total Assets Current liabilities (no interest) Long-term liabilities (8% interest) Common stock ($5 par value, 5,200 shares outstanding) Retained earnings Total Liabilities Equity % % % value 5.00 points P13-5 Part 2 2. By what amount did the current ratio change? (Round your intermediate calculations and final answer to 2 decimal places.) Current ratio change


