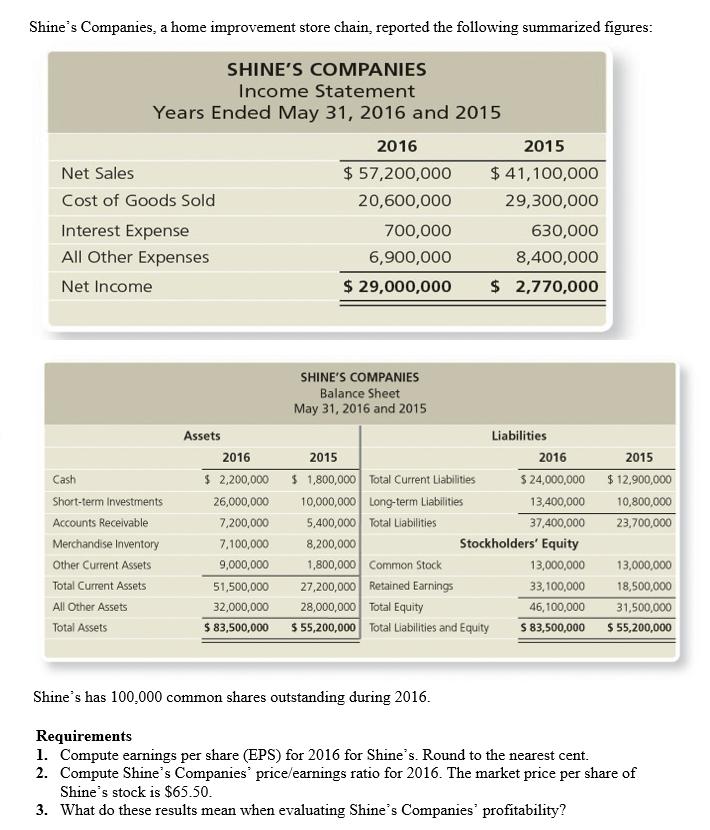
Shine's Companies, a home improvement store chain, reported the following summarized figures: SHINE'S COMPANIES Income Statement Years Ended May 31, 2016 and 2015 2016

Shine's Companies, a home improvement store chain, reported the following summarized figures: SHINE'S COMPANIES Income Statement Years Ended May 31, 2016 and 2015 2016 2015 Net Sales $ 57,200,000 $ 41,100,000 Cost of Goods Sold 20,600,000 29,300,000 Interest Expense 700,000 630,000 All Other Expenses 6,900,000 8,400,000 Net Income $ 29,000,000 $ 2,770,000 SHINE'S COMPANIES Balance Sheet May 31, 2016 and 2015 Assets Liabilities 2016 2015 2016 2015 $ 2,200,000 $ 1,800,000 Total Current Liabilities 10,000,000 Long-term Liabilities 5,400,000 Total Liabilities .200,000 1,800,000 Common Stock 27,200,000 Retained Earnings 28,000,000 Total Equity $ 5,200,000 Total Liabilities and Equity Cash $ 24,000,000 $ 12,900,000 Short-term Investments 26,000,000 13,400,000 10,800,000 Accounts Receivable 7,200,000 37,400,000 23,700,000 Merchandise Inventory 7.100,000 Stockholders' Equity Other Current Assets 9,000,000 13,000,000 13,000,000 Total Current Assets 51,500,000 33,100,000 18,500,000 All Other Assets 32,000,000 46,100,000 31,500,000 $ 83,500,000 S 83,500,000 $ 55,200,000 Total Assets Shine's has 100,000 common shares outstanding during 2016. Requirements 1. Compute earnings per share (EPS) for 2016 for Shine's. Round to the nearest cent. 2. Compute Shine's Companies' price/earnings ratio for 2016. The market price per share of Shine's stock is $65.50. 3. What do these results mean when evaluating Shine's Companies' profitability?
Step by Step Solution
3.45 Rating (148 Votes )
There are 3 Steps involved in it
Step: 1
Question 1 Earnings per Share for 2016 Net Income available to Common Stockholders Common Shares Out...
See step-by-step solutions with expert insights and AI powered tools for academic success
Step: 2

Step: 3

Ace Your Homework with AI
Get the answers you need in no time with our AI-driven, step-by-step assistance
Get Started


