Question
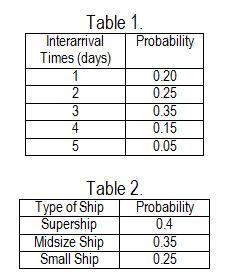
Ships arrive at an oil port in Panama with the distribution of interarrival times shown in Table 1. The port has two terminals, A and
Ships arrive at an oil port in Panama with the distribution of interarrival times shown in Table 1. The port has two terminals, A and B. Terminal B is newer and therefore more efficient that terminal A. The time it takes to unload a ship depends on the ship's size. A superchip's takes 4 days to unload at terminal A and 3 days at terminal B. A midsize ship takes 3 days at terminal A and 2 days at terminal B. The small ships take 2 days at terminal A and 1 day at terminal B. Arriving ships form single waiting line in the port area until a terminal becomes available for service. Service is given on an FCFS basis. The type of ship and the frequency with which they visit this port is given by the distribution in Table 2. Develop a simulation model for this port. Compute such statistics as the average number of ships in port, the average number of days in port for a ship, and the percentage of idle time for each of the terminals.

Interarrival Times (days) 1 2 3 4 Table 1. 5 Probability 0.20 0.25 Table 2. Type of Ship Supership Midsize Ship Small Ship 0.35 0.15 0.05 Probability 0.4 0.35 0.25
Step by Step Solution
3.56 Rating (156 Votes )
There are 3 Steps involved in it
Step: 1

Get Instant Access to Expert-Tailored Solutions
See step-by-step solutions with expert insights and AI powered tools for academic success
Step: 2

Step: 3

Ace Your Homework with AI
Get the answers you need in no time with our AI-driven, step-by-step assistance
Get Started


