should i change some answer ?
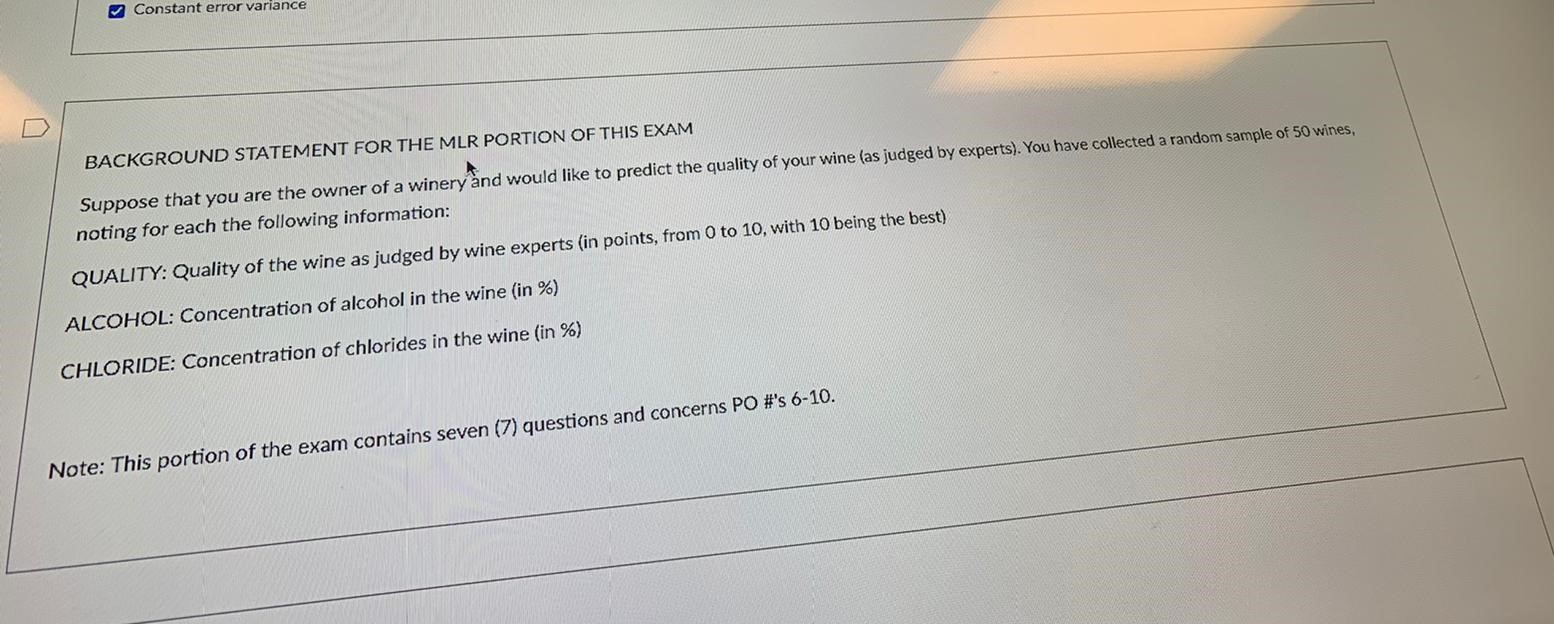
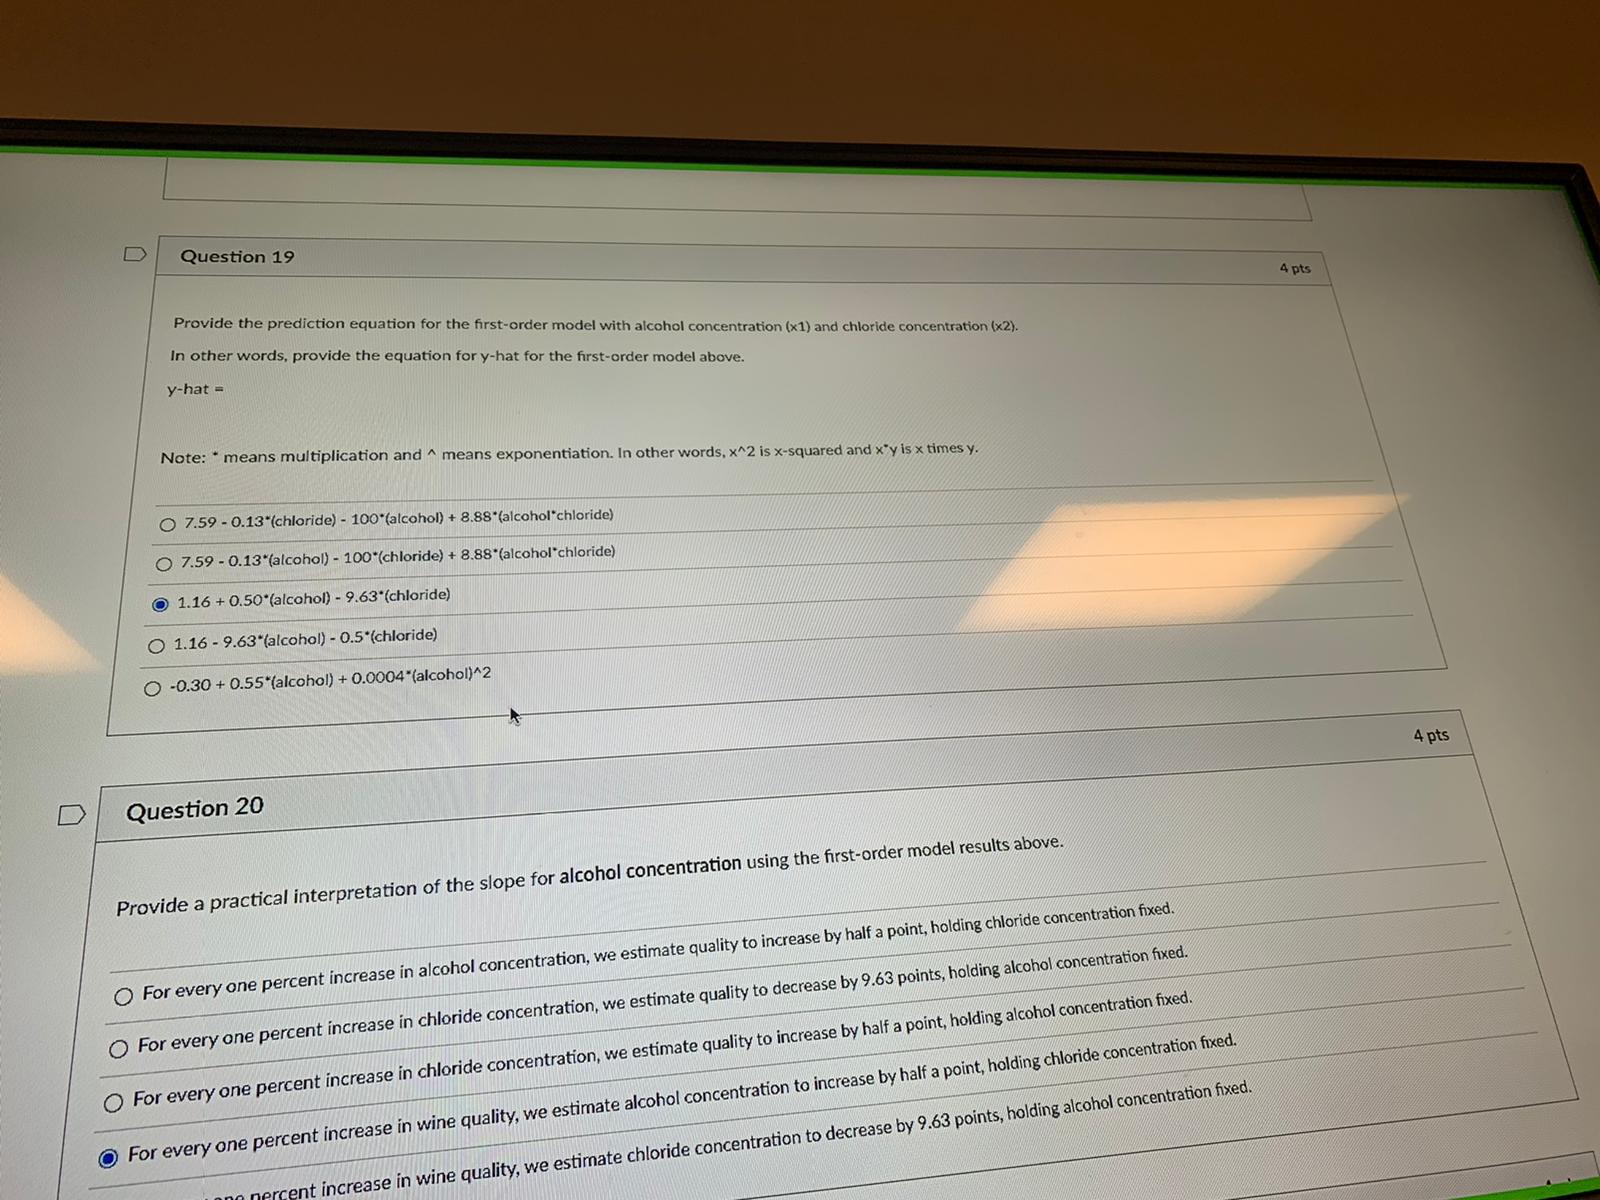
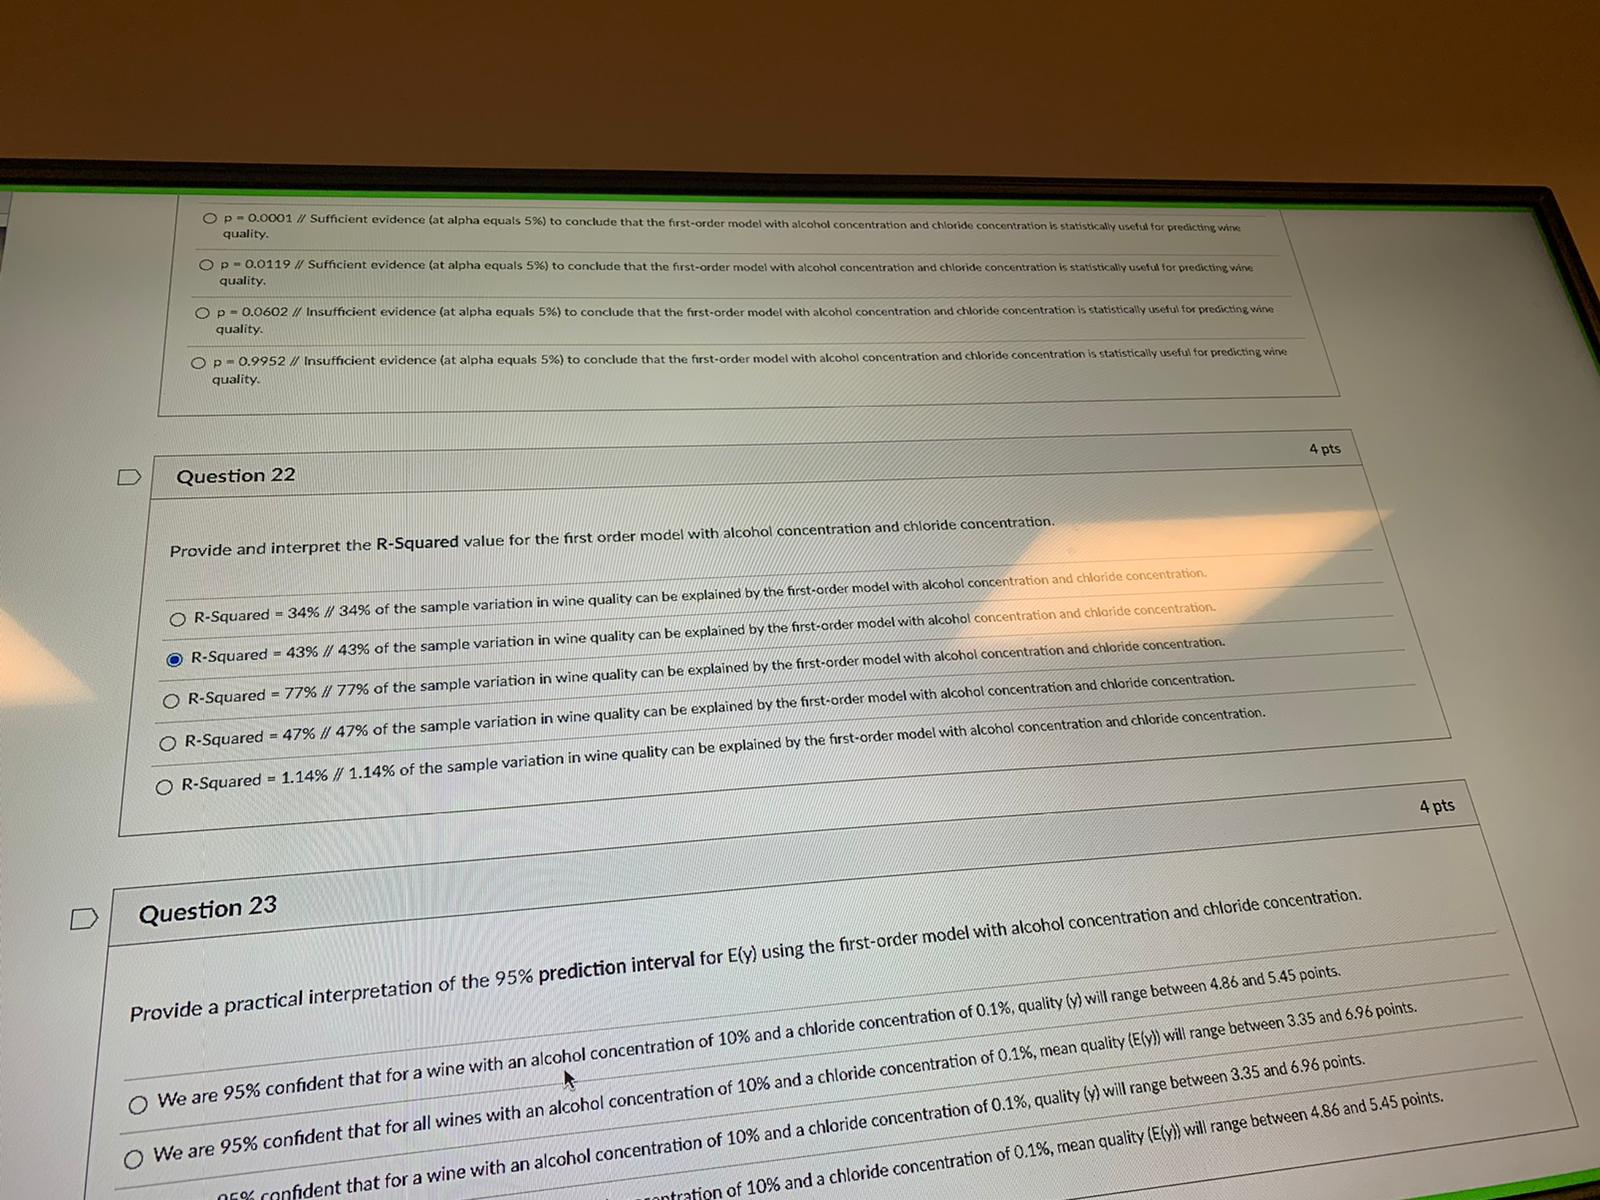
Constant error variance BACKGROUND STATEMENT FOR THE MLR PORTION OF THIS EXAM Suppose that you are the owner of a winery and would like to predict the quality of your wine (as judged by experts). You have collected a random sample of 50 wines, noting for each the following information: QUALITY: Quality of the wine as judged by wine experts (in points, from 0 to 10, with 10 being the best) ALCOHOL: Concentration of alcohol in the wine (in %) CHLORIDE: Concentration of chlorides in the wine (in %) Note: This portion of the exam contains seven (7) questions and concerns PO #'s 6-10.D Question 19 4 pts Provide the prediction equation for the first-order model with alcohol concentration (x1) and chloride concentration (x2). In other words, provide the equation for y-hat for the first-order model above. y-hat = Note: * means multiplication and ^ means exponentialion. In other words, x^2 is x-squared and x"y is x times y. 7.59 - 0.13"(chloride) - 100'(alcohol) + 8.88*(alcohol"chloride) O 7.59 - 0.13"(alcohol) - 100*(chloride) + 8.88*(alcohol"chloride) 1.16 + 0.50*(alcohol) - 9.63*(chloride) 1.16 - 9.63"(alcohol) - 0.5*(chloride) O -0.30 + 0.55*(alcohol) + 0.0004*(alcohol)^2 4 pts D Question 20 Provide a practical interpretation of the slope for alcohol concentration using the first-order model results above. For every one percent increase in alcohol concentration, we estimate quality to increase by half a point, holding chloride concentration fixed. For every one percent increase in chloride concentration, we estimate quality to decrease by 9.63 points, holding alcohol concentration fixed. For every one percent increase in chloride concentration, we estimate quality to increase by half a point, holding alcohol concentration fixed. For every one percent increase in wine quality, we estimate alcohol concentration to increase by half a point, holding chloride concentration fixed. t increase in wine quality, we estimate chloride concentration to decrease by 9.63 points, holding alcohol concentration fixed.For every one percent increase in chloride concentration, we estimate quality to decrease by 9.63 points, holding alcohol concentration fried. For every one percent increase in chloride concentration, we estimate quality to increase by half a point. holding alcohol concentration fixed. For every one percent increase in wine quality, we estimate alcohol conc ncrease by half a point, holding chloride concentration fixed. For every one percent increase in wine quality, we estimate chloride concentration to decrease by 9.63 points, holding alcohol concentration fixed. D Question 21 4 pts Provide a practical interpretation (and p-value) for the test of statistical utility for the first-order model with alcohol (x1) and chloride (x2). O p - 0.0000 // Sufficient evidence (at alpha equals 5%) to conclude that the first-order model with alcohol concentration and chloride concentration is statistically useful for predicting wine quality. O p = 0.0001 // Sufficient evidence (at alpha equals 5%) to conclude that the first-order model with alcohol concentration and chloride concentration is statistically useful for predicting wine quality. O p = 0.0119 // Sufficient evidence (at alpha equals 5%) to conclude that the first-order model with alcohol concentration and chloride concentration is statistically useful for predicting wine quality O p = 0.0602 // Insufficient evidence (at alpha equals 5%) to conclude that the first-order model with alcohol concentration and chloride concentration is statistically useful for predicting wine quality O p = 0.9952 // Insufficient evidence (at alpha equals 5%) to conclude that the first-order model with alcohol concentration and chloride concentration is statistically useful for predicting wine 4 pts D Question 22 Provide and interpret the R-Squared value for the first order model with alcohol concentration and chloride concentration. R-Squared = 34% // 34% of the sample variation in wine quality can be explained by the first-order model with alcohol concentration and chloride concentration. O R-Squared = 43% // 43% of the sample variation in wine quality can be explained by the first-order model with alcohol concentration and chloride concentration. the sample variation in wine quality can be explained by the first-order model with alcohol concentration and chloride concentration. d by the first-order model with alcohol concentration and chloride concentration. on and chloride concentration.quality. Op - 0.0001 // Sufficient evidence (at alpha equals 5%) to conclude that the first-order model with alcohol concentration and chloride concentration is statistically useful for predicting wine quality Op - 0.0119 // Sufficient evidence (at alpha equals 5%) to conclude that the first-order model with alcohol concentration and chloride concentration is statistically useful for predicting wine quality. O p - 0.0602 // Insufficient evidence (at alpha equals 5%) to conclude that the first-order model with alcohol concentration and chloride concentration is statistically useful for predicting wine quality. Op- 0.9952 // Insufficient evidence (at alpha equals 5%) to conclude that the first-order model with alcohol concentration and chloride concentration is statistically useful for predicting wine D Question 22 4 pts Provide and interpret the R-Squared value for the first order model with alcohol concentration and chloride concentration. OR-Squared = 34% // 34% of the sample variation in wine quality can be explained by the first-order model with alcohol concentration and chloride concentration. O R-Squared = 43% // 43% of the sample variation in wine quality can be explained by the first-order model with alcohol concentration and chloride concentration. O R-Squared = 77% // 77% of the sample variation in wine quality can be explained by the first-order model with alcohol concentration and chloride concentration. R-Squared = 47% // 47% of the sample variation in wine quality can be explained by the first-order model with alcohol concentration and chloride concentration. O R-Squared = 1.14% // 1.14% of the sample variation in wine quality can be explained by the first-order model with alcohol concentration and chloride concentration. 4 pts D Question 23 Provide a practical interpretation of the 95% prediction interval for E(y) using the first-order model with alcohol concentration and chloride concentration. We are 95% confident that for a wine with an alcohol concentration of 10% and a chloride concentration of 0.1%, quality (y) will range between 4.86 and 5.45 points. We are 95% confident that for all wines with an alcohol concentration of 10% and a chloride concentration of 0.1%, mean quality (E(y)) will range between 3.35 and 6.96 points. ofident that for a wine with an alcohol concentration of 10% and a chloride concentration of 0.1%, quality (y) will range between 3.35 and 6.96 points. on of 10% and a chloride concentration of 0.1%, mean quality (E(y)) will range between 4.86 and 5.45 points./20 // 47% of the sample variation in wine quality can be explained by the first-order model with alcohol concentration and chloride concentration. on and chloride concentration OR-Squared = 1.14% // 1.14% of the sample variation in wine quality can be explained by the first-order model with alcohol concentration and chloride concentration. D Question 23 4 pts Provide a practical interpretation of the 95% prediction interval for E(y) using the first-order model with alcohol concentration and chloride concentration. We are 95% confident that for a wine with an alcohol concentration of 10% and a chloride concentration of 0.1%, quality (y) will range between 4.86 and 5.45 points. We are 95% confident that for all wines with an alcohol concentration of 10% and a chloride concentration of 0.1%, mean quality (E(y)) will range between 3.35 and 6.96 points. We are 95% confident that for a wine with an alcohol concentration of 10% and a chloride concentration of 0.1%, quality (y) will range between 3.35 and 6.96 points. We are 95% confident that for all wines with an alcohol concentration of 10% and a chloride concentration of 0.1%, mean quality (Ely)) will range between 4.86 and 5.45 points. D Question 24 4 pts Provide a practical interpretation (and p-value) for the test to determine whether the relationship between wine quality and alcohol concentration depends on chloride concentration (i.e., test for interaction). O p = 0.0000 // Sufficient evidence (at alpha equals 5%) of interaction between alcohol concentration (x1) and chloride concentration (x2) in predicting wine quality (y) O p = 0.0602 // Insufficient evidence (at alpha equals 5%) of interaction between alcohol concentration (x1) and chloride concentration (x2) in predicting wine quality (y) O p = 0.0389 // Sufficient evidence (at alpha equals 5%) of interaction between alcohol concentration (x1) and chloride concentration (x2) in predicting wine quality (y) O p = 0.9952 // Insufficient evidence (at alpha equals 5%) of interaction between alcohol concentration (x1) and chloride concentration (x2) in predicting wine quality (y) O p = 0.0119 / Sufficient evidence (at alpha equals 5%) of interaction between alcohol concentration (x1) and chloride concentration (x2) in predicting wine quality (y) TOSHIBAOp - 0.0000 // Sufficient evidence (at alpha equals 5%) of interaction between alcohol concentration (x1) and chloride concentration (x2) in predicting wine quality () O p - 0.0602 // Insufficient evidence (at alpha equals 5%) of interaction between alcohol concentration (x1) and chloride concentration (x2) in predicting wine quality by) O p - 0.0389 // Sufficient evidence (at alpha equals 5%) of interaction between alcohol con 10% concentration (x1) and chloride concentration (x2) in predicting wine quality (yl O p - 0.9952 // Insufficient evidence (at alpha equals 5%) of interaction between alcohol concentration (x 1) and chloride concentration (x2) in predicting wine quality ) Op- 0.0119 // Sufficient evidence (at alpha equals 5%) of interaction between alcohol concentration (x1) and chloride concentration (x2) in predicting wine quality (y) D Question 25 4 pts Provide a practical interpretation (and p-value) for the test to determine whether the relationship between wine quality and alcohol concentration depends on alcohol concentration (i.e., test for curvature). O p - 0.9952 // Insufficient evidence (at alpha equals 5%) of curvature between alcohol concentration (x1) and wine quality ly) Op- 0.0389 // Sufficient evidence (at alpha equals 5%) of curvature between alcohol concentration (x1) and wine quality (y) p - 0.0000 // Sufficient evidence (at alpha equals 5%) of curvature between alcohol concentration (x1) and wine quality ty) Op- 0.0602 // Insufficient evidence (at alpha equals 5%) of curvature between alcohol concentration (x1) and wine quality (y) Op = 0.0119 // Sufficient evidence (at alpha equals 5%) of curvature between alcohol concentration (x1) and wine quality (y) No new data to save. Last checked at 8:44pm Submit Quiz TOSHIBA
