Answered step by step
Verified Expert Solution
Link Copied!

Question

1 Approved Answer

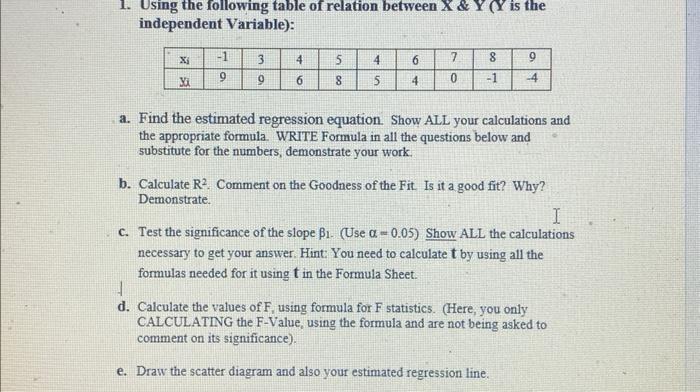
Show all work, no excel 1. Using the following table of relation between X&Y(Y is the independent Variable): a. Find the estimated regression equation. Show

Show all work, no excel
image text in transcribed
1. Using the following table of relation between X&Y(Y is the independent Variable): a. Find the estimated regression equation. Show ALL your calculations and the appropriate formula. WRITE Formula in all the questions below and substitute for the numbers, demonstrate your work. b. Calculate R2. Comment on the Goodness of the Fit. Is it a good fit? Why? Demonstrate. c. Test the significance of the slope 1. (Use =0.05 ) Show ALL the calculations necessary to get your answer. Hint: You need to calculate t by using all the formulas needed for it using t in the Formula Sheet. d. Calculate the values of F, using formula for F statistics. (Here, you only CALCULATING the F-Value, using the formula and are not being asked to comment on its significance). e. Draw the scatter diagram and also your estimated regression line. The formula for the correlation coefficient between x and y is: r=[(xx)2][(yy)2](xx)(yy) or the algebraic equivalent: r=[n(x2)(x)2][n(y2)(y)2]nxyxy Where, n is the number of observation in the sample. Slope and y-Intercept for the Estimated Regression Equation b1=xi2(xi)2xiyi(xiyt)b0=yb1x Estimated Regression Equation: Y=b0+b1X Coefficient of Determination (For Simple Regreasion): Computational Formula for SSR (Simple Regression) Computational Formula for SST SSR=x2(x)2[x,y(x,y,y]2 SST=y2(y)2 The following apply in both Simple and Multiple Regression cases: r2=SSTSSRAdjustedr2=1n1SSTn(k+1)SSE Sum of Squares Due to Error Total Sum of Squares SSE=2(y1y1)2 SST=(yiy)2 Sum of Squares Due to Regression Relationship among SST, SSR and SST SSR=(yiy)2 SST=SSR+SSE Mean Square Error Standard Error of the Estimate Estimated Standard Deviation s2=MSE=n2SSEs=MSE=n2SSEsn=x2(x)2ofb tTest Statistic FTest Statistic: ti=SbibiF=MSEMSR=n(k+1)SSEkSSR Mean Square Error: =MSE=n(k+1)SSE where k is the number of independent variables Mean Table of the Student's t-distribution

Step by Step Solution

There are 3 Steps involved in it

Step: 1

blur-text-image

Get Instant Access to Expert-Tailored Solutions

See step-by-step solutions with expert insights and AI powered tools for academic success

Step: 2

blur-text-image

Step: 3

blur-text-image

Ace Your Homework with AI

Get the answers you need in no time with our AI-driven, step-by-step assistance

Get Started

Recommended Textbook for

College Accounting A Practical Approach Chapters 1-25

Authors: Jeffrey Slater

10th Edition

0132286386, 978-0132286381

More Books

Students also viewed these Accounting questions