show all work please
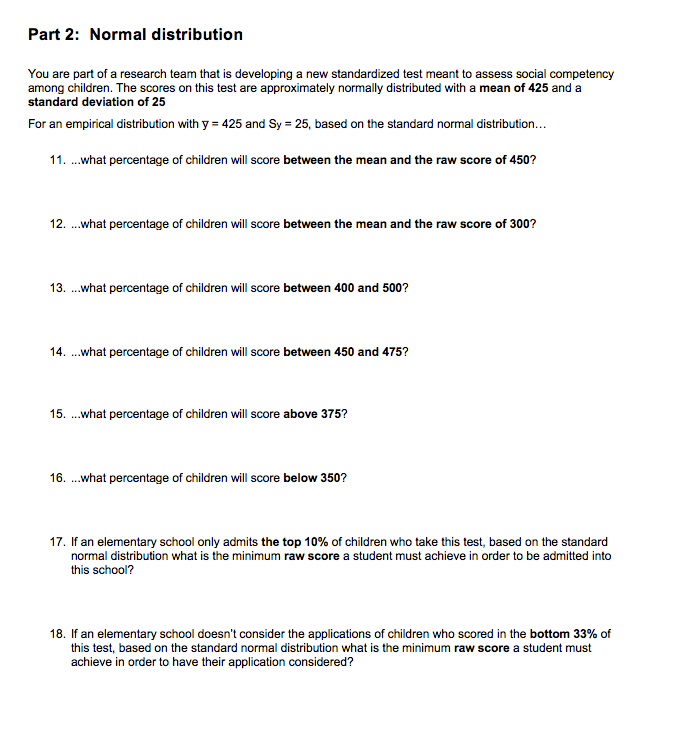
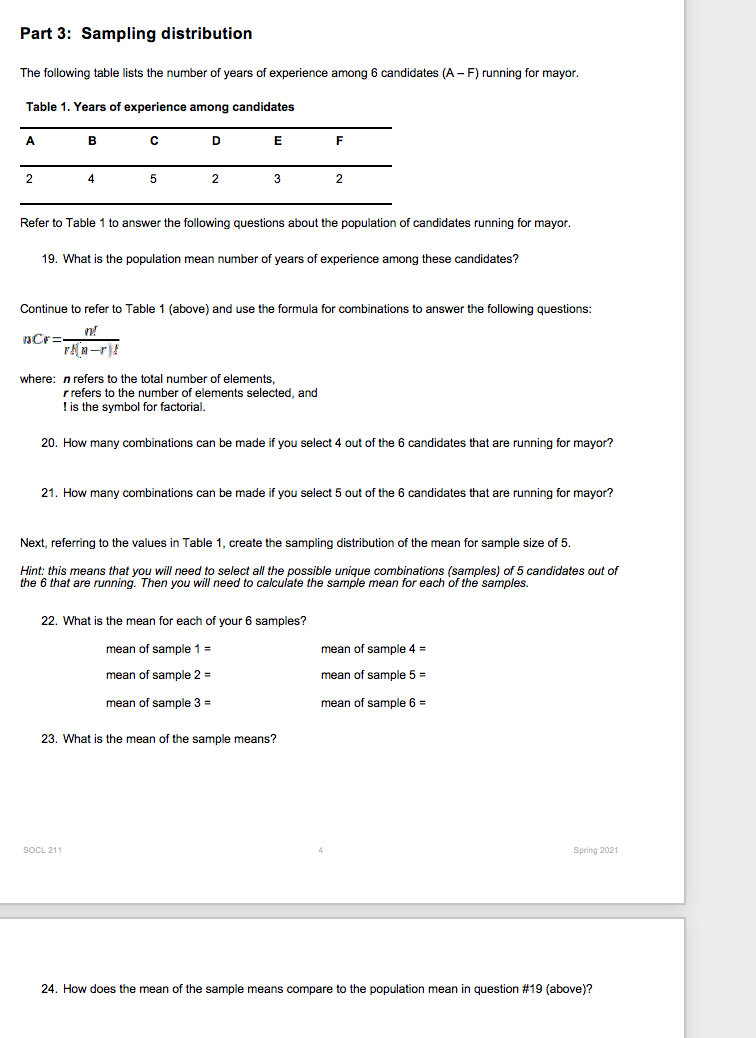
Part 2: Normal distribution You are part of a research team that is developing a new standardized test meant to assess social competency among children. The scores on this test are approximately normally distributed with a mean of 425 and a standard deviation of 25 For an empirical distribution with y = 425 and Sy = 25, based on the standard normal distribution... 11. ..what percentage of children will score between the mean and the raw score of 450? 12. ..what percentage of children will score between the mean and the raw score of 300? 13. ..what percentage of children will score between 400 and 500? 14. ..what percentage of children will score between 450 and 475? 15. ..what percentage of children will score above 375? 16. ..what percentage of children will score below 350? 17. If an elementary school only admits the top 10% of children who take this test, based on the standard normal distribution what is the minimum raw score a student must achieve in order to be admitted into this school? 18. If an elementary school doesn't consider the applications of children who scored in the bottom 33% of this test, based on the standard normal distribution what is the minimum raw score a student must achieve in order to have their application considered?Part 3: Sampling distribution The following table lists the number of years of experience among 6 candidates (A - F) running for mayor. Table 1. Years of experience among candidates B C D E F 5 2 3 2 Refer to Table 1 to answer the following questions about the population of candidates running for mayor. 19. What is the population mean number of years of experience among these candidates? Continue to refer to Table 1 (above) and use the formula for combinations to answer the following questions: FAB-ri! where: In refers to the total number of elements, refers to the number of elements selected, and I is the symbol for factorial. 20. How many combinations can be made if you select 4 out of the 6 candidates that are running for mayor? 21. How many combinations can be made if you select 5 out of the 6 candidates that are running for mayor? Next, referring to the values in Table 1, create the sampling distribution of the mean for sample size of 5. Hint: this means that you will need to select all the possible unique combinations (samples) of 5 candidates out of the 6 that are running. Then you will need to calculate the sample mean for each of the samples. 22. What is the mean for each of your 6 samples? mean of sample 1 = mean of sample 4 = mean of sample 2 = mean of sample 5 = mean of sample 3 = mean of sample 6 = 23. What is the mean of the sample means? SOCL 211 Spring 2021 24. How does the mean of the sample means compare to the population mean in question #19 (above)


