Answered step by step
Verified Expert Solution
Question
1 Approved Answer
SHOW ALL YOUR SUPPORTING CALCULATIONS! You may do this either within the cell by using formulas, out to the right, or both-clearly labeling your


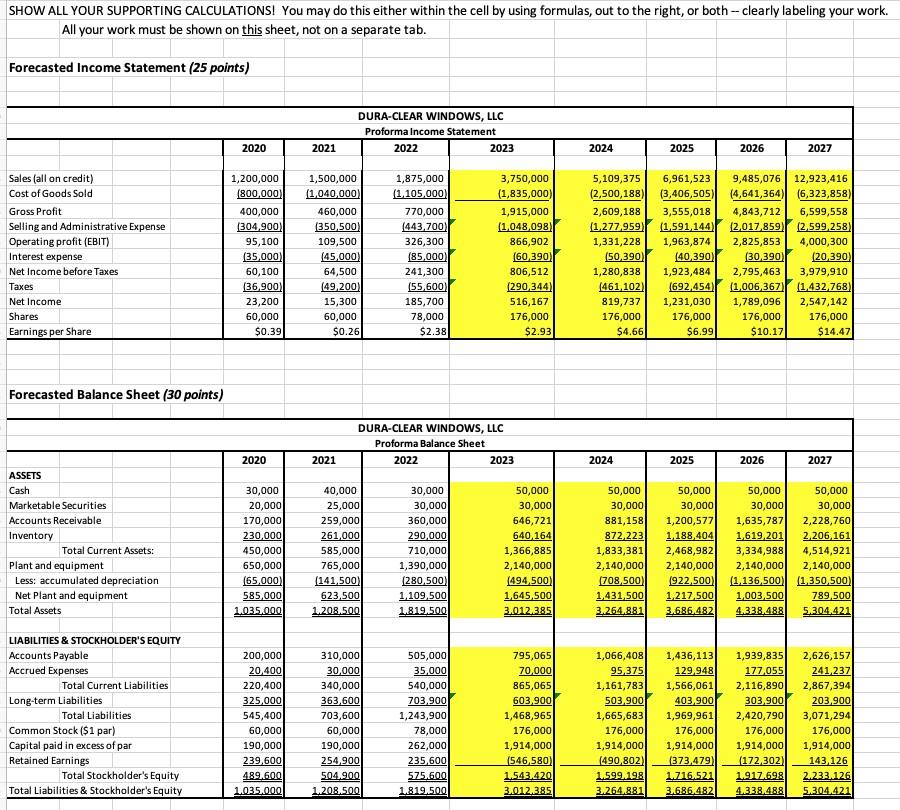
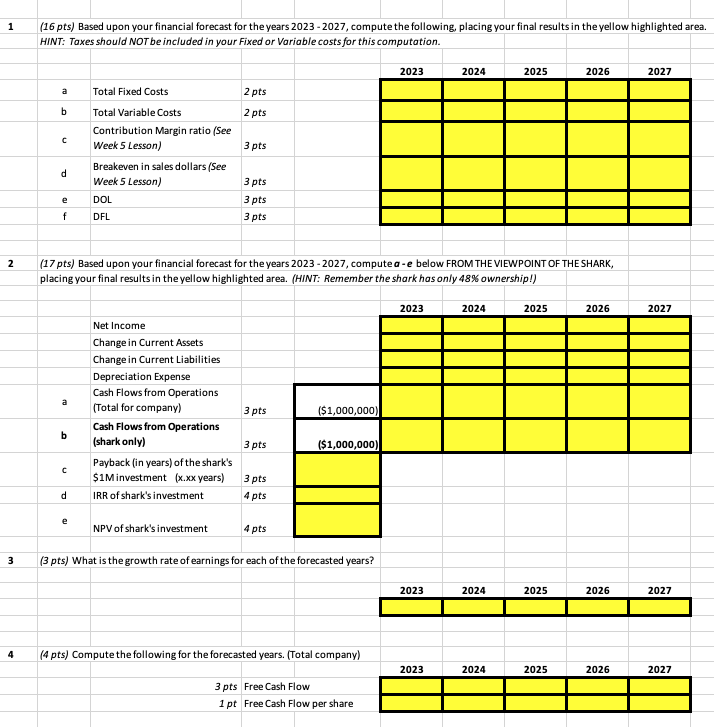
SHOW ALL YOUR SUPPORTING CALCULATIONS! You may do this either within the cell by using formulas, out to the right, or both-clearly labeling your work. All your work must be shown on this sheet, not on a separate tab. Forecasted Income Statement (25 points) Sales (all on credit) Cost of Goods Sold Gross Profit Selling and Administrative Expense Operating profit (EBIT) Interest expense Net Income before Taxes Taxes Net Income Shares Earnings per Share Forecasted Balance Sheet (30 points) ASSETS Cash Marketable Securities Accounts Receivable Inventory Total Current Assets: Plant and equipment Less: accumulated depreciation Net Plant and equipment Total Assets LIABILITIES & STOCKHOLDER'S EQUITY Accounts Payable Accrued Expenses Total Current Liabilities Long-term Liabilities Total Liabilities Common Stock ($1 par) Capital paid in excess of par Retained Earnings Total Stockholder's Equity Total Liabilities & Stockholder's Equity 2020 1,200,000 (800,000) 400,000 (304,900) 95,100 (35,000) 60,100 (36,900) 23,200 60,000 $0.39 2020 30,000 20,000 170,000 230,000 450,000 650,000 (65,000) 585,000 1.035.000 200,000 20,400 220,400 325,000 545,400 60,000 190,000 239,600 489,600 1.035,000 2021 DURA-CLEAR WINDOWS, LLC Proforma Income Statement 1,500,000 (1,040,000) 460,000 (350,500) 109,500 (45,000) 64,500 (49,200) 15,300 60,000 $0.26 2021 40,000 25,000 259,000 261,000 585,000 765,000 (141,500) 623,500 1,208,500 310,000 30,000 340,000 363,600 703,600 60,000 2022 190,000 254,900 504,900 1.208.500 1,875,000 (1,105,000) 770,000 (443,700) 326,300 (85,000) 241,300 (55,600) 185,700 78,000 $2.38 DURA-CLEAR WINDOWS, LLC Proforma Balance Sheet 2022 30,000 30,000 360,000 290,000 710,000 1,390,000 (280,500) 1,109,500 1.819.500 505,000 35,000 540,000 703,900 1,243,900 2023 78,000 262,000 235,600 575,600 1.819.500 3,750,000 (1,835,000) 1,915,000 (1,048,098) 866,902 (60,390) 806,512 (290,344) 516,167 176,000 $2.93 2023 50,000 30,000 646,721 640,164 1,366,885 2,140,000 (494,500) 1,645,500 3.012.385 795,065 70,000 865,065 603,900 1,468,965 176,000 1,914,000 (546,580) 1.543.420 3.012.385 2024 2025 2024 2026 5,109,375 6,961,523 9,485,076 12,923,416 (2,500,188) (3,406,505) (4,641,364) (6,323,858) 4,843,712 6,599,558 2,609,188 3,555,018 (1,277,959) (1,591,144) (2,017,859) (2,599,258) 1,331,228 1,963,874 2,825,853 4,000,300 (50,390) (40,390) (30,390) (20,390) 1,280,838 1,923,484 2,795,463 3,979,910 (461,102) (692,454) (1,006,367) (1,432,768) 819,737 1,231,030 1,789,096 2,547,142 176,000 176,000 176,000 176,000 $6.99 $4.66 $10.17 2025 2027 2026 $14.47 2027 50,000 50,000 50,000 30,000 30,000 30,000 881,158 1,200,577 1,635,787 2,228,760 2,206,161 872,223 1,188,404 1,619,201 1,833,381 2,468,982 3,334,988 4,514,921 2,140,000 2,140,000 2,140,000 2,140,000 (708,500) (922,500) (1,136,500) (1,350,500) 1,431,500 1,217,500 1,003,500 789,500 3.264,881 3.686.482 4.338.488 5.304.421 50,000 30,000 1,066,408 2,626,157 241,237 2,867,394 203,900 3,071,294 1,436,113 1,939,835 95,375 129,948 177,055 1,161,783 1,566,061 2,116,890 503,900 403,900 303,900 1,665,683 1,969,961 2,420,790 176,000 176,000 176,000 176,000 1,914,000 1,914,000 1,914,000 1,914,000 (490,802) (373,479) (172,302) 143,126 1.599.198 1.716.521 1.917.698 2.233.126 3.264.881 3.686.482 4.338.488 5.304.421 1 2 3 4 (16 pts) Based upon your financial forecast for the years 2023-2027, compute the following, placing your final results in the yellow highlighted area. HINT: Taxes should NOT be included in your Fixed or Variable costs for this computation. a b d e f a b d Total Fixed Costs Total Variable Costs Contribution Margin ratio (See Week 5 Lesson) e Breakeven in sales dollars (See Week 5 Lesson) DOL DFL Net Income Change in Current Assets Change in Current Liabilities Depreciation Expense Cash Flows from Operations (Total for company) Cash Flows from Operations (shark only) (17 pts) Based upon your financial forecast for the years 2023-2027, computea-e below FROM THE VIEWPOINT OF THE SHARK, placing your final results in the yellow highlighted area. (HINT: Remember the shark has only 48% ownership!) Payback (in years) of the shark's $1M investment (x.xx years) IRR of shark's investment 2 pts 2 pts NPV of shark's investment 3 pts 3 pts 3 pts 3 pts 3 pts 3 pts 3 pts 4 pts 4 pts ($1,000,000) ($1,000,000) (3 pts) What is the growth rate of earnings for each of the forecasted years? 2023 (4 pts) Compute the following for the forecasted years. (Total company) 3 pts Free Cash Flow 1 pt Free Cash Flow per share 2023 2023 2024 2023 2024 2024 2025 2024 2025 2025 2026 2025 2026 2026 2026 2027 2027 2027 2027
Step by Step Solution
There are 3 Steps involved in it
Step: 1
To analyze the forecasted income statement and balance sheet for DURACLEAR WINDOWS LLC I will perform calculations based on the provided data Lets start with the income statement 1 Calculate Gross Pro...
Get Instant Access to Expert-Tailored Solutions
See step-by-step solutions with expert insights and AI powered tools for academic success
Step: 2

Step: 3

Ace Your Homework with AI
Get the answers you need in no time with our AI-driven, step-by-step assistance
Get Started


