

Answered step by step
Verified Expert Solution
Question
1 Approved Answer
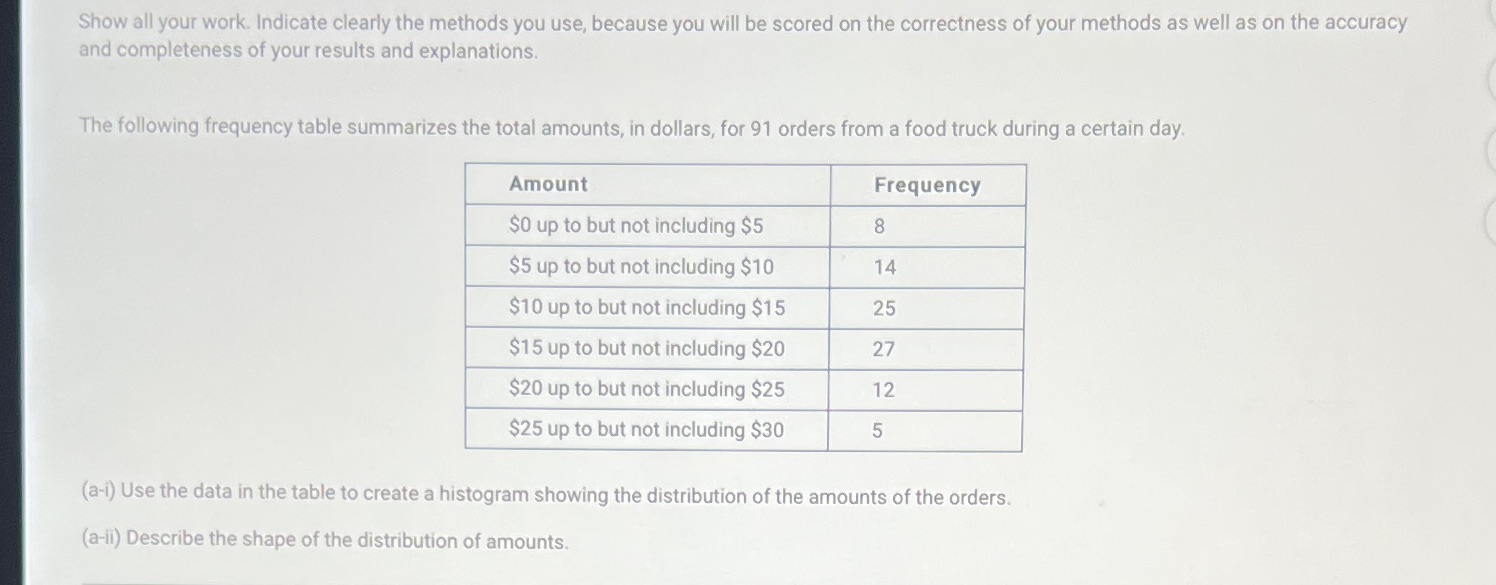
Show all your work. Indicate clearly the methods you use, because you will be scored on the correctness of your methods as well as on
Step by Step Solution
There are 3 Steps involved in it
Step: 1

Get Instant Access to Expert-Tailored Solutions
See step-by-step solutions with expert insights and AI powered tools for academic success
Step: 2

Step: 3
Ace Your Homework with AI
Get the answers you need in no time with our AI-driven, step-by-step assistance
Get Started
Precalculus, Enhanced WebAssign Edition
Authors: James Stewart
6th Edition
1285499948, 9781285499949