

Answered step by step
Verified Expert Solution
Question
1 Approved Answer
show me how to create this graph in tableauMeasures and Dimensions The Sales field is used as a measure in this view. Specifically, it is
show me how to create this graph in tableauMeasures and
Dimensions
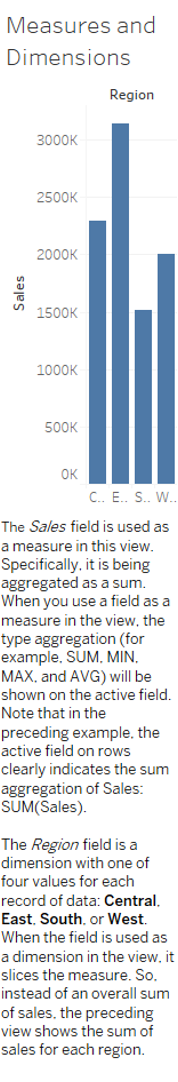
The Sales field is used as
a measure in this view.
Specifically, it is being
aggregated as a sum.
When you use a field as a
measure in the view, the
type aggregation for
example. SUM. MIN.
MAX and AVG will be
shown on the active field.
Note that in the
preceding example. the
active field on rows
clearly indicates the sum
aggregation of Sales:
SUMSales
The Region field is a
dimension with one of
four values for each
record of data: Central.
East. South. or West.
When the field is used as
a dimension in the view, it
slices the measure. So
instead of an overall sum
of sales. the preceding
view shows the sum of
sales for each region.
Step by Step Solution
There are 3 Steps involved in it
Step: 1

Get Instant Access to Expert-Tailored Solutions
See step-by-step solutions with expert insights and AI powered tools for academic success
Step: 2

Step: 3
Ace Your Homework with AI
Get the answers you need in no time with our AI-driven, step-by-step assistance
Get Started
Visual C# And Databases
Authors: Philip Conrod, Lou Tylee
16th Edition
1951077083, 978-1951077082