Answered step by step
Verified Expert Solution
Question
1 Approved Answer
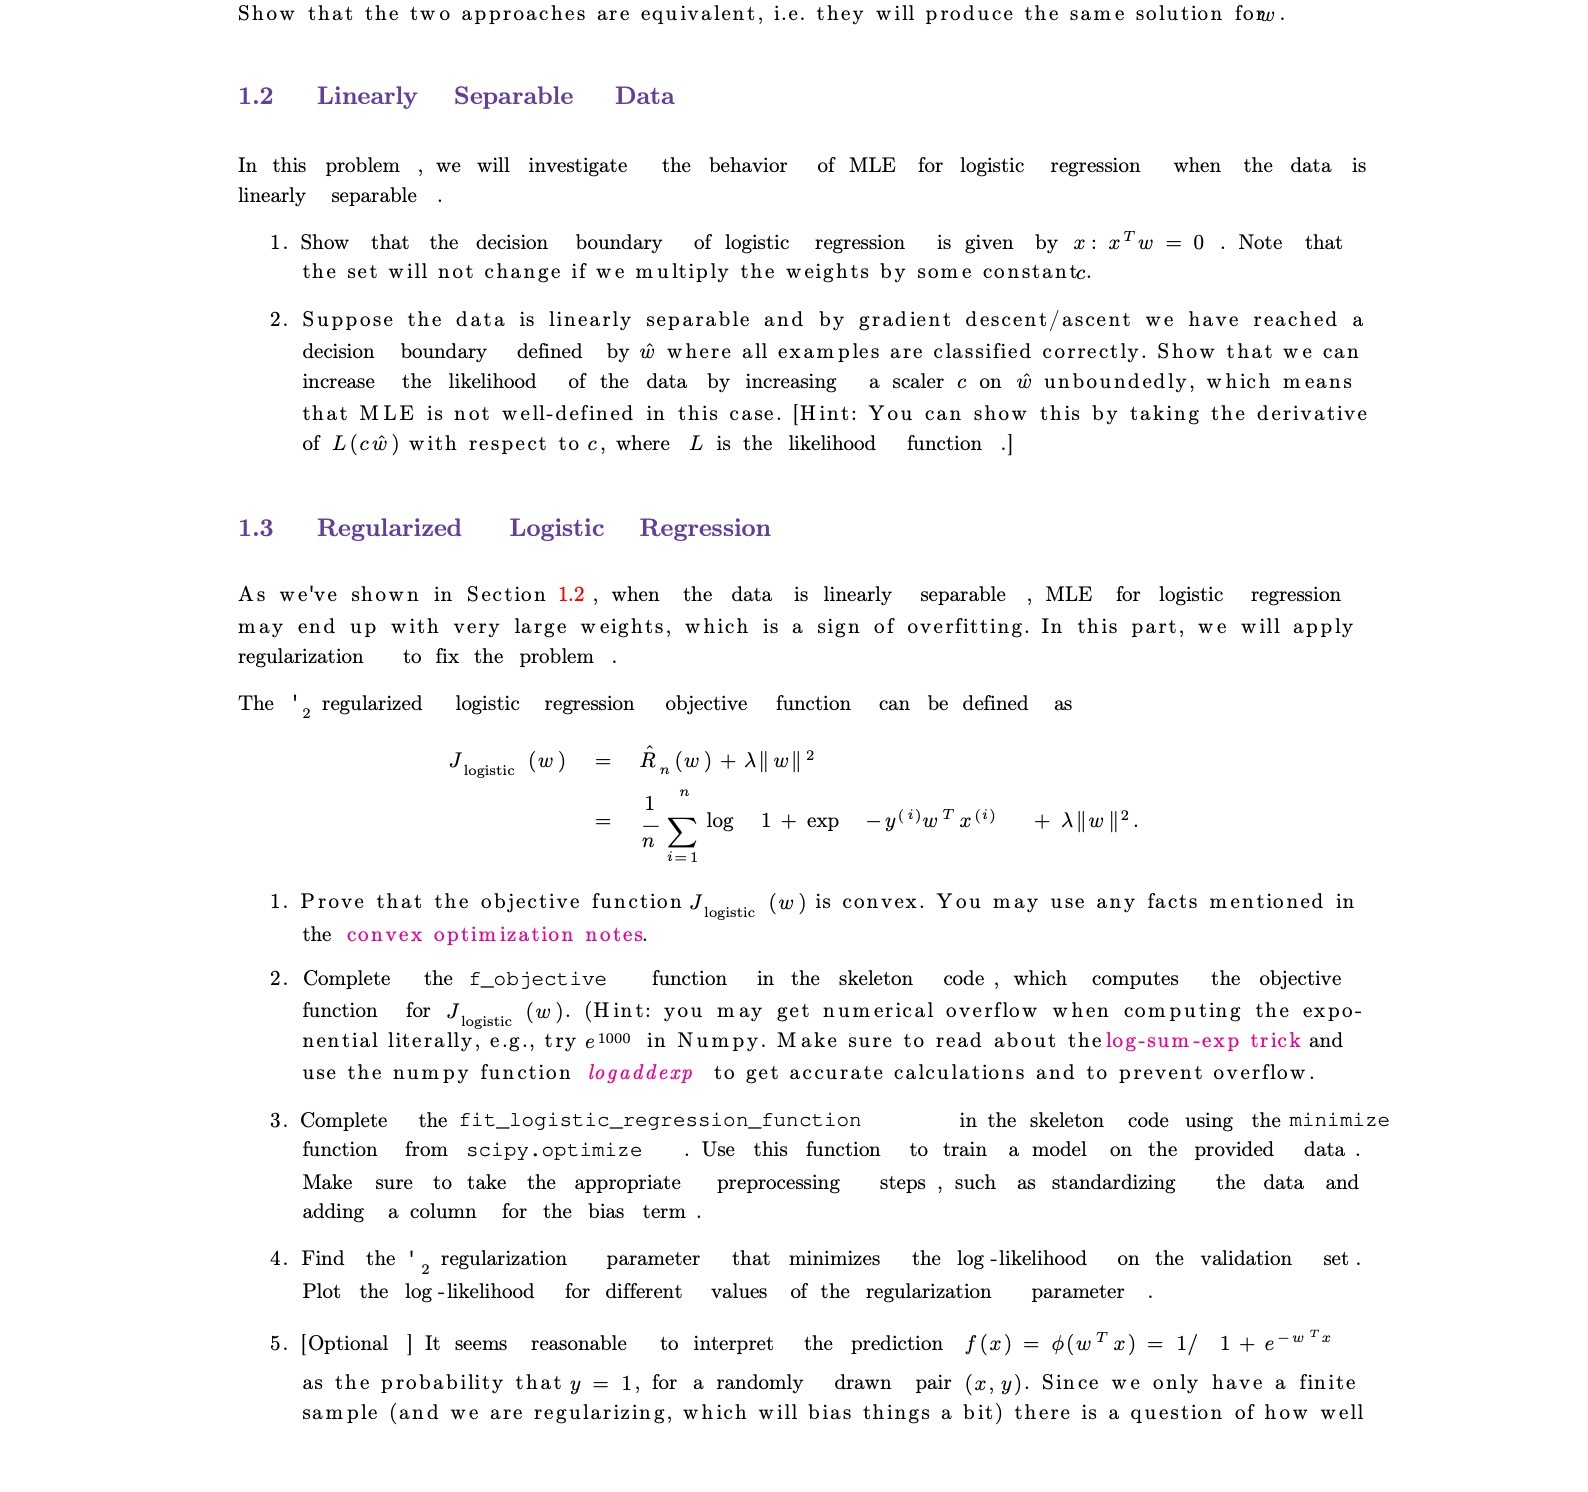
Show that the two approaches are equivalent, i.e. they will produce the same solution for. 1.2 Linearly Separable Data In this problem we will

Show that the two approaches are equivalent, i.e. they will produce the same solution for. 1.2 Linearly Separable Data In this problem we will investigate the behavior linearly separable. " 1. Show that the decision boundary of logistic regression is given by x: xTu w 0. Note that the set will not change if we multiply the weights by some constantc. 1.3 2. Suppose the data is linearly separable and by gradient descent/ascent we have reached a decision boundary defined by w where all examples are classified correctly. Show that we can increase the likelihood of the data by increasing a scaler c on w unboundedly, which means that MLE is not well-defined in this case. [Hint: You can show this by taking the derivative of L(cw) with respect to c, where L is the likelihood function] 2 Regularized Logistic Regression As we've shown in Section 1.2, when the data is linearly separable MLE for logistic regression may end up with very large weights, which is a sign of overfitting. In this part, we will apply regularization to fix the problem The regularized logistic regression objective function J logistic (w) = n (w) + X || w || 1 n of MLE for logistic regression when the data is i=1 log 1. Prove that the objective function J. the convex optimization notes. 1 + exp can be defined as (i) w Tx(i) 3. Complete the fit logistic_regression_function function from scipy.optimize " logistic (w) is convex. You may use any facts mentioned in + X || w || . code, 2. Complete the f_objective function in the skeleton which computes the objective function for J. logistic (w). (Hint: you may get numerical overflow when computing the expo- nential literally, e.g., try e 1000 in Numpy. Make sure to read about the log-sum-exp trick and use the numpy function logaddexp to get accurate calculations and to prevent overflow. " in the skeleton code using the minimize Use this function to train a model on the provided data. Make sure to take the appropriate preprocessing steps such as standardizing the data and adding a column for the bias term. 2 4. Find the ' regularization parameter that minimizes the log -likelihood on the validation set. Plot the log - likelihood for different values of the regularization parameter -w Tr 5. [Optional] It seems reasonable to interpret the prediction f(x) (w Tx) 1/ 1+e-u as the probability that y = 1, for a randomly drawn pair (x, y). Since we only have a finite sample (and we are regularizing, which will bias things a bit) there is a question of how well = =
Step by Step Solution
There are 3 Steps involved in it
Step: 1
1 In the case of linearly separable data the decision boundary of logistic regression is represented by the equation zw0 where z is the feature vector ...
Get Instant Access to Expert-Tailored Solutions
See step-by-step solutions with expert insights and AI powered tools for academic success
Step: 2

Step: 3

Ace Your Homework with AI
Get the answers you need in no time with our AI-driven, step-by-step assistance
Get Started


