

Answered step by step
Verified Expert Solution
Question
1 Approved Answer
Show the detailed solution! And the final result of question c! Problem 4. Data Distribution (20 points) Table 3 shows 2, 100 student grades and
Show the detailed solution! And the final result of question c!
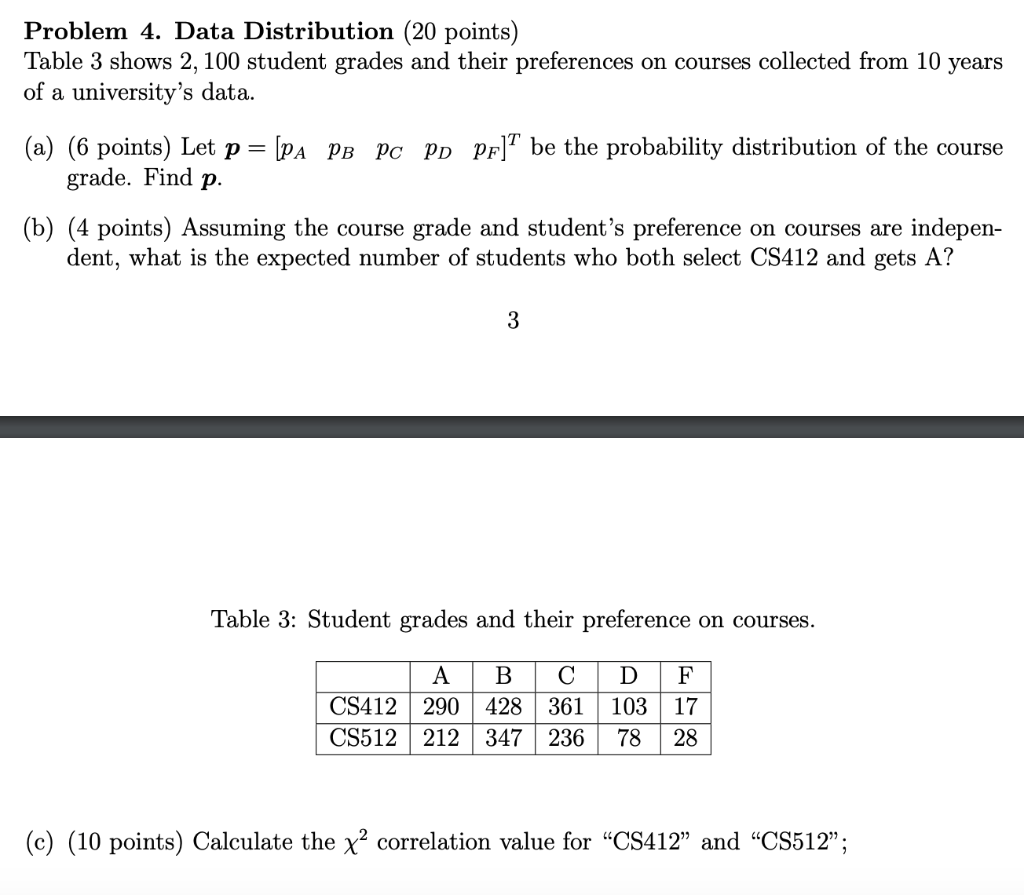
Problem 4. Data Distribution (20 points) Table 3 shows 2, 100 student grades and their preferences on courses collected from 10 years of a university's data. (a) (6 points) Let p=[pApBpCpDpF]T be the probability distribution of the course grade. Find p. (b) (4 points) Assuming the course grade and student's preference on courses are independent, what is the expected number of students who both select CS412 and gets A? 3 Table 3: Student grades and their preference on courses. (c) (10 points) Calculate the 2 correlation value for "CS412" and "CS512Step by Step Solution
There are 3 Steps involved in it
Step: 1

Get Instant Access to Expert-Tailored Solutions
See step-by-step solutions with expert insights and AI powered tools for academic success
Step: 2

Step: 3
Ace Your Homework with AI
Get the answers you need in no time with our AI-driven, step-by-step assistance
Get Started
Sams Teach Yourself Beginning Databases In 24 Hours
Authors: Ryan Stephens, Ron Plew
1st Edition
067232492X, 978-0672324925