Question: Show the graph and fill in the report sheet Lab 14 Charles' Law Introduction: The volume an amount of trapped gas occupies depends on the
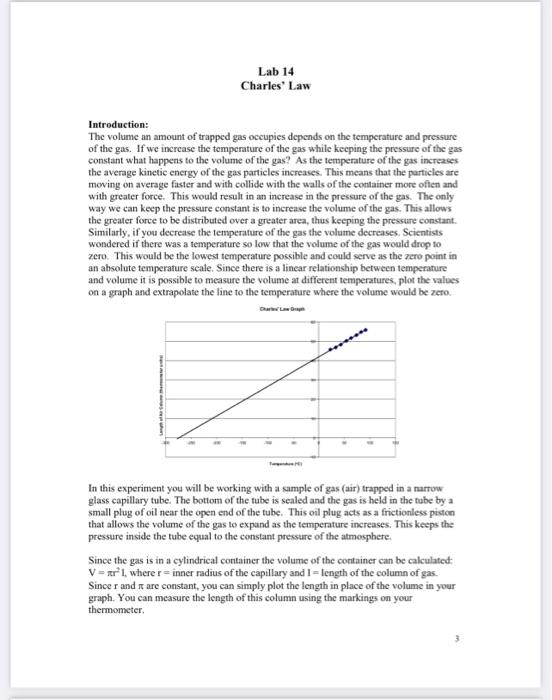
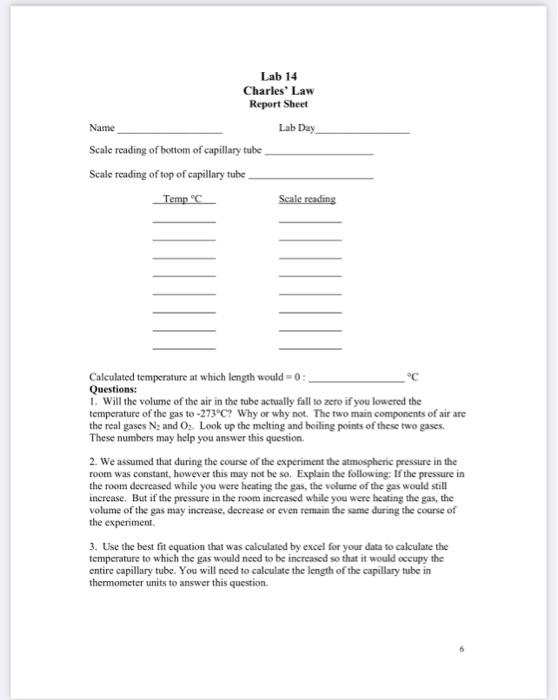
Lab 14 Charles' Law Introduction: The volume an amount of trapped gas occupies depends on the temperature and pressure of the gas. If we increase the temperature of the gas while keeping the pressure of the gas constant what happens to the volume of the gas? As the temperature of the gas increases the average kinetic energy of the gas particles increases. This means that the particles are moving on average faster and with collide with the walls of the container more often and with greater force. This would result in an increase in the pressure of the gas. The only way we can keep the pressure constant is to increase the volume of the gas. This allows the greater force to be distributed over a greater area, thus keeping the pressure constant. Similarly, if you decrease the temperafure of the gas the volume decreases. Scientists wondered if there was a temperature so low that the volume of the gas would drop to zero. This would be the lowest temperature possible and could serve as the zero point in an absolute temperature seale. Since there is a linear relationship between temperature and volume it is possible to measure the volume at different temperatures, plot the values on a graph and extrapolate the line to the temperature where the volume would be zero. In this experiment you will be working with a sample of gas (air) trapped in a marrow glass capillary tube. The bottom of the tube is sealed and the gas is held in the tube by a small plug of oil near the open end of the tube. This oil plug acts as a frictionless piston that allows the volume of the gas to expand as the temperature increases. This keeps the pressure inside the tube equal to the constant pressure of the atmosphere. Since the gas is in a cylindrical container the volume of the container can be calculated: V=r2I, where r= inner radius of the capillary and I = length of the column of gas. Since r and are constant, you can simply plot the length in place of the volume in your graph. You can measure the length of this column using the markings on your thermometer. Procedure: 1. Obtain a thermometer to which a capillary tube with an oil plug has been attached with two small bands. Be sure the bottom of the capillary is at or above the lowest mark on the thermometer scale. Record the exact thermometer scale reading of the location of the bottom of the capillary tube. (Remember that the lowest mark is 20.0C, so the line above this is 19.0C. Also measure the exact thermometer scale reading for the tog of the capillary tube. (You'll need this for one of the questions.) 2. Place a hot plate on the buse of a ring stand place a large beaker on the hot plate (the bot plate should not be on yet!). Suspend a large test tube inside the beaker with a clamp. Place the capillary tube/thermometer assembly inside the test tube and add cold tap water to the test tube until the level of the water is just above the level of the oil plug the capillary tube. Pour water into the beaker until it covers the level of water in the test tube. 3. Measure the location of the bottom of the oil plug in thermometer units. Begin heating the beaker slowly. You should stir the water inside the test tube with the thermometer before making each measurement. Record the exact temperature to the nearest 0.1C and the scale reading of the bottom of the oil plug after each approximately 10 rise in temperature. Continue taking readings until the temperature is above 90C. The more slowly you raise the temperature the more accurate your results will be. Graphing your data: -Set up an excel spreadsheet with the labels "Temperature" in cell A1, "Scale Reading" in cell B2 and "Length" in cell Cl. -Enter your temperature measurements in the cells of column A and the corresponding scale readings in the cells of column B. -In cell C2 enter you can calculate the length of the air column by subtracting the scale reading of the bottom of the tube from the scale reading of the bottom of the oil plug. All excel formulas must begin with an equal sign (=). So, if the bottom of your capillary tube were at the 18.0 mark on the thermometer, you would enter the following formula in cell C2:B2(18.0) [Use your actual seale reading in this equation!] - Click back in cell C2 and drag down to calculate the length for the rest of your data. -Use the forecast function in Excel to determine the temperature at which the length would theoretically fall to zero. Assuming you have data in rows 2 through 9 , enter the following formula in any unused cell: =forecast (0,A2:A9,C2,C9) The value displayed in this cell should be the temperature where the volume would be zero. - To plot your data, click on the Insert tab and select the seatter graph option that doesn't connect the points. -Click on the Select Data icon. Click Add. Type: Charles' Law in the Series Name box. Click in the X-values box, then click on the Collapse Dialog icon at the end of the box. This takes you back to the original spreadsheet. Click and drag down the values for the temperatures in the A column. Then click back on the collapse dialog icon at the end of the small souree data box. Do the same for the y-values box, selecting the length values in the C column. Click OK in the remaining dialog boxes. - To label your axes. Each different version of exeel has a different way for doing this. When in doubt, click on help. -Right click on one of the points in your graph and then select Add Trendline from the menu. Make sure the linear option is selected. In the Forecast: Backwards box enter a number equal to the difference between the temperature you calculated using the forecast command above and your lowest measured temperature. For example, if your calculated temperature is 273C and your lowest measured temperature is 23C you will need to Forecast backwards 293 units. This will extrapolate the best-fit line back to the point where the length (and therefore the volume) equals zero. Check the Display Equation on chart" box. You will need this equation for one of the questions. -Print your graph and attach it to your lab report. It is a good idea to save a copy of this spreadsheet on your flashdrive or email it to yourself. Calculated temperature at which length would =0 : C Questions: 1. Will the volume of the air in the tube actually fall to zero if you lowered the temperature of the gas to +273C ? Why or why not. The two main components of air are the real gases N2 and O2. Look up the melting and boiling points of these two gases. These numbers may help you answer this question. 2. We assumed that during the course of the experiment the atmosphenic pressure in the room was constant, however this may not be so. Explain the following: If the pressure in the room decreased while you were heating the gas, the volume of the gas would still increase. But if the pressure in the room increased while you were heating the gas, the volume of the gas may increase, decrease or even remain the same during the course of the experiment. 3. Use the best fit equation that was calculated by excel for your data to calculate the temperature to which the gas would need to be increased so that it would oceupy the entire capillary tube. You will need to calculate the length of the capillary tube in thermometer units to answer this question. Extra Credit: Assuming that the air inside the tube is an ideal gas with a pressure of 1.000 atm calculate the mass of the air inside the tube. Assume that the air is composed of only N2 and O2 and that the mole fractions of the gasses are: N2=0.7780 and O2=0.2120. You may assume an inner radius of 0.062cm for the capillary tube. If you choose to do this you will have to find a way to convert the scale readings into cm. Rulers are available in the lab. Lab 14 Charles' Law Introduction: The volume an amount of trapped gas occupies depends on the temperature and pressure of the gas. If we increase the temperature of the gas while keeping the pressure of the gas constant what happens to the volume of the gas? As the temperature of the gas increases the average kinetic energy of the gas particles increases. This means that the particles are moving on average faster and with collide with the walls of the container more often and with greater force. This would result in an increase in the pressure of the gas. The only way we can keep the pressure constant is to increase the volume of the gas. This allows the greater force to be distributed over a greater area, thus keeping the pressure constant. Similarly, if you decrease the temperafure of the gas the volume decreases. Scientists wondered if there was a temperature so low that the volume of the gas would drop to zero. This would be the lowest temperature possible and could serve as the zero point in an absolute temperature seale. Since there is a linear relationship between temperature and volume it is possible to measure the volume at different temperatures, plot the values on a graph and extrapolate the line to the temperature where the volume would be zero. In this experiment you will be working with a sample of gas (air) trapped in a marrow glass capillary tube. The bottom of the tube is sealed and the gas is held in the tube by a small plug of oil near the open end of the tube. This oil plug acts as a frictionless piston that allows the volume of the gas to expand as the temperature increases. This keeps the pressure inside the tube equal to the constant pressure of the atmosphere. Since the gas is in a cylindrical container the volume of the container can be calculated: V=r2I, where r= inner radius of the capillary and I = length of the column of gas. Since r and are constant, you can simply plot the length in place of the volume in your graph. You can measure the length of this column using the markings on your thermometer. Procedure: 1. Obtain a thermometer to which a capillary tube with an oil plug has been attached with two small bands. Be sure the bottom of the capillary is at or above the lowest mark on the thermometer scale. Record the exact thermometer scale reading of the location of the bottom of the capillary tube. (Remember that the lowest mark is 20.0C, so the line above this is 19.0C. Also measure the exact thermometer scale reading for the tog of the capillary tube. (You'll need this for one of the questions.) 2. Place a hot plate on the buse of a ring stand place a large beaker on the hot plate (the bot plate should not be on yet!). Suspend a large test tube inside the beaker with a clamp. Place the capillary tube/thermometer assembly inside the test tube and add cold tap water to the test tube until the level of the water is just above the level of the oil plug the capillary tube. Pour water into the beaker until it covers the level of water in the test tube. 3. Measure the location of the bottom of the oil plug in thermometer units. Begin heating the beaker slowly. You should stir the water inside the test tube with the thermometer before making each measurement. Record the exact temperature to the nearest 0.1C and the scale reading of the bottom of the oil plug after each approximately 10 rise in temperature. Continue taking readings until the temperature is above 90C. The more slowly you raise the temperature the more accurate your results will be. Graphing your data: -Set up an excel spreadsheet with the labels "Temperature" in cell A1, "Scale Reading" in cell B2 and "Length" in cell Cl. -Enter your temperature measurements in the cells of column A and the corresponding scale readings in the cells of column B. -In cell C2 enter you can calculate the length of the air column by subtracting the scale reading of the bottom of the tube from the scale reading of the bottom of the oil plug. All excel formulas must begin with an equal sign (=). So, if the bottom of your capillary tube were at the 18.0 mark on the thermometer, you would enter the following formula in cell C2:B2(18.0) [Use your actual seale reading in this equation!] - Click back in cell C2 and drag down to calculate the length for the rest of your data. -Use the forecast function in Excel to determine the temperature at which the length would theoretically fall to zero. Assuming you have data in rows 2 through 9 , enter the following formula in any unused cell: =forecast (0,A2:A9,C2,C9) The value displayed in this cell should be the temperature where the volume would be zero. - To plot your data, click on the Insert tab and select the seatter graph option that doesn't connect the points. -Click on the Select Data icon. Click Add. Type: Charles' Law in the Series Name box. Click in the X-values box, then click on the Collapse Dialog icon at the end of the box. This takes you back to the original spreadsheet. Click and drag down the values for the temperatures in the A column. Then click back on the collapse dialog icon at the end of the small souree data box. Do the same for the y-values box, selecting the length values in the C column. Click OK in the remaining dialog boxes. - To label your axes. Each different version of exeel has a different way for doing this. When in doubt, click on help. -Right click on one of the points in your graph and then select Add Trendline from the menu. Make sure the linear option is selected. In the Forecast: Backwards box enter a number equal to the difference between the temperature you calculated using the forecast command above and your lowest measured temperature. For example, if your calculated temperature is 273C and your lowest measured temperature is 23C you will need to Forecast backwards 293 units. This will extrapolate the best-fit line back to the point where the length (and therefore the volume) equals zero. Check the Display Equation on chart" box. You will need this equation for one of the questions. -Print your graph and attach it to your lab report. It is a good idea to save a copy of this spreadsheet on your flashdrive or email it to yourself. Calculated temperature at which length would =0 : C Questions: 1. Will the volume of the air in the tube actually fall to zero if you lowered the temperature of the gas to +273C ? Why or why not. The two main components of air are the real gases N2 and O2. Look up the melting and boiling points of these two gases. These numbers may help you answer this question. 2. We assumed that during the course of the experiment the atmosphenic pressure in the room was constant, however this may not be so. Explain the following: If the pressure in the room decreased while you were heating the gas, the volume of the gas would still increase. But if the pressure in the room increased while you were heating the gas, the volume of the gas may increase, decrease or even remain the same during the course of the experiment. 3. Use the best fit equation that was calculated by excel for your data to calculate the temperature to which the gas would need to be increased so that it would oceupy the entire capillary tube. You will need to calculate the length of the capillary tube in thermometer units to answer this question. Extra Credit: Assuming that the air inside the tube is an ideal gas with a pressure of 1.000 atm calculate the mass of the air inside the tube. Assume that the air is composed of only N2 and O2 and that the mole fractions of the gasses are: N2=0.7780 and O2=0.2120. You may assume an inner radius of 0.062cm for the capillary tube. If you choose to do this you will have to find a way to convert the scale readings into cm. Rulers are available in the lab
Step by Step Solution
There are 3 Steps involved in it

Get step-by-step solutions from verified subject matter experts


