

Answered step by step
Verified Expert Solution
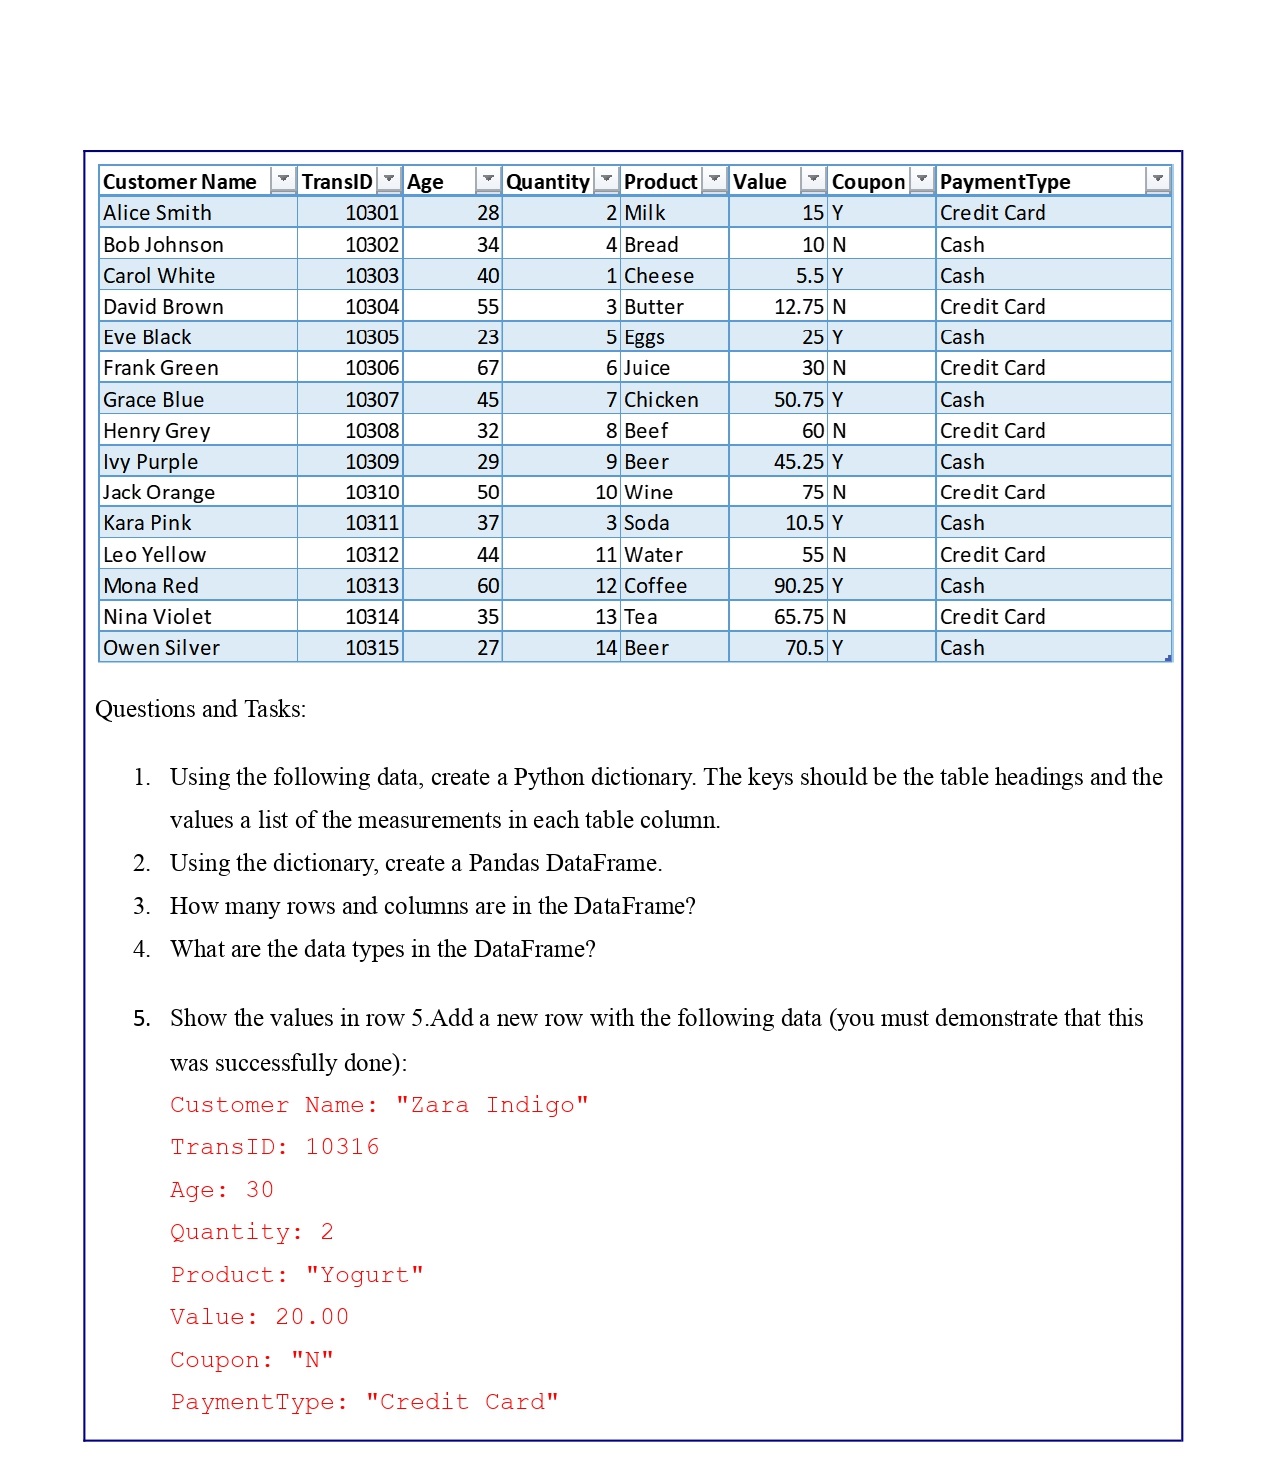
Question
1 Approved Answer
Show the values in columns 2 and 5 ONLY. Change the names of column TransID and Product to TransactionNumber and ItemBought respectively. Using list comprehension,
Show the values in columns and ONLY.
Change the names of column "TransID" and "Product" to "TransactionNumber" and "ItemBought"
respectively.
Using list comprehension, generate a new list that has values for each: TransactionNumber modulo
Insert the list as a new column between CustomerName and TransactionNumber in the existing
DataFrame. The column name should be called TransactionHash.
Show the values in the DataFrame sorted by Age then by CustomerName for viewing purposes
only
Delete the TransactionNumber series from the dataset.
Show the observations rows that meet the following criteria:
Transactions in which or more of any items were bought.
More than $ was spent without a Coupon.
Replace all instances of "Cash" in the PaymentType column with "Debit Card".
Calculate the total value of all transactions where a Coupon was used.
Determine the average age of customers who paid with a Credit Card.
Create a new column "TotalCost" that is the product of "Quantity" and "Value".
Group the DataFrame by "Product" and calculate the sum of "Quantity" for each product.
Create a pivot table showing the sum of "Value" for each "PaymentType" and "Coupon"
combination.
Visualize the distribution of ages using a histogram.
Export the DataFrame to a CSV file named "transactions.csv
Calculate the correlation matrix for the numerical columns in the DataFrame.
Identify and display the rows with duplicate 'Customer Name' entries, if any.
Convert the 'Value' column to a different currency eg from USD to EUR assuming a conversion
rate of USDEUR. Add this as a new column named 'ValueEUR'.
Filter and display transactions made by customers who are over years old.
Create a summary table that shows the mean, median, and standard deviation of the 'Value' column
for each 'Product'.
Use a bar plot to visualize the total 'Quantity' sold for each 'Product'.
For each 'PaymentType', calculate the total 'Value' of transactions and display it using a pie chart. Implement a function that takes a product name as an argument and returns all transactions
involving that product. Demonstrate the function with an example.
Determine the most frequent 'Product' in the dataset and show its frequency.
Calculate the cumulative sum of 'Value' for transactions sorted by 'TransID'. Add this as a new
column named 'CumulativeValue'.
Normalize the 'Age' column using MinMax normalization. Add the normalized values as a new
column named 'NormalizedAge'.
Extract and display all transactions where the 'Customer Name' contains the substring 'Brown'.
Generate a scatter plot to visualize the relationship between 'Age' and 'Quantity'.
Create a new column 'AgeGroup' that categorizes customers into 'Youth' below 'Adult'
and 'Senior' above
Implement a method to handle missing values: assume some values in 'Coupon' column are
missing, and replace them with N Demonstrate this on a modified dataset.Help need
Step by Step Solution
There are 3 Steps involved in it
Step: 1

Get Instant Access to Expert-Tailored Solutions
See step-by-step solutions with expert insights and AI powered tools for academic success
Step: 2

Step: 3
Ace Your Homework with AI
Get the answers you need in no time with our AI-driven, step-by-step assistance
Get Started
Pro SQL Server Wait Statistics
Authors: Enrico Van De Laar
1st Edition
1484211391, 9781484211397