Answered step by step
Verified Expert Solution
Link Copied!

Question

1 Approved Answer

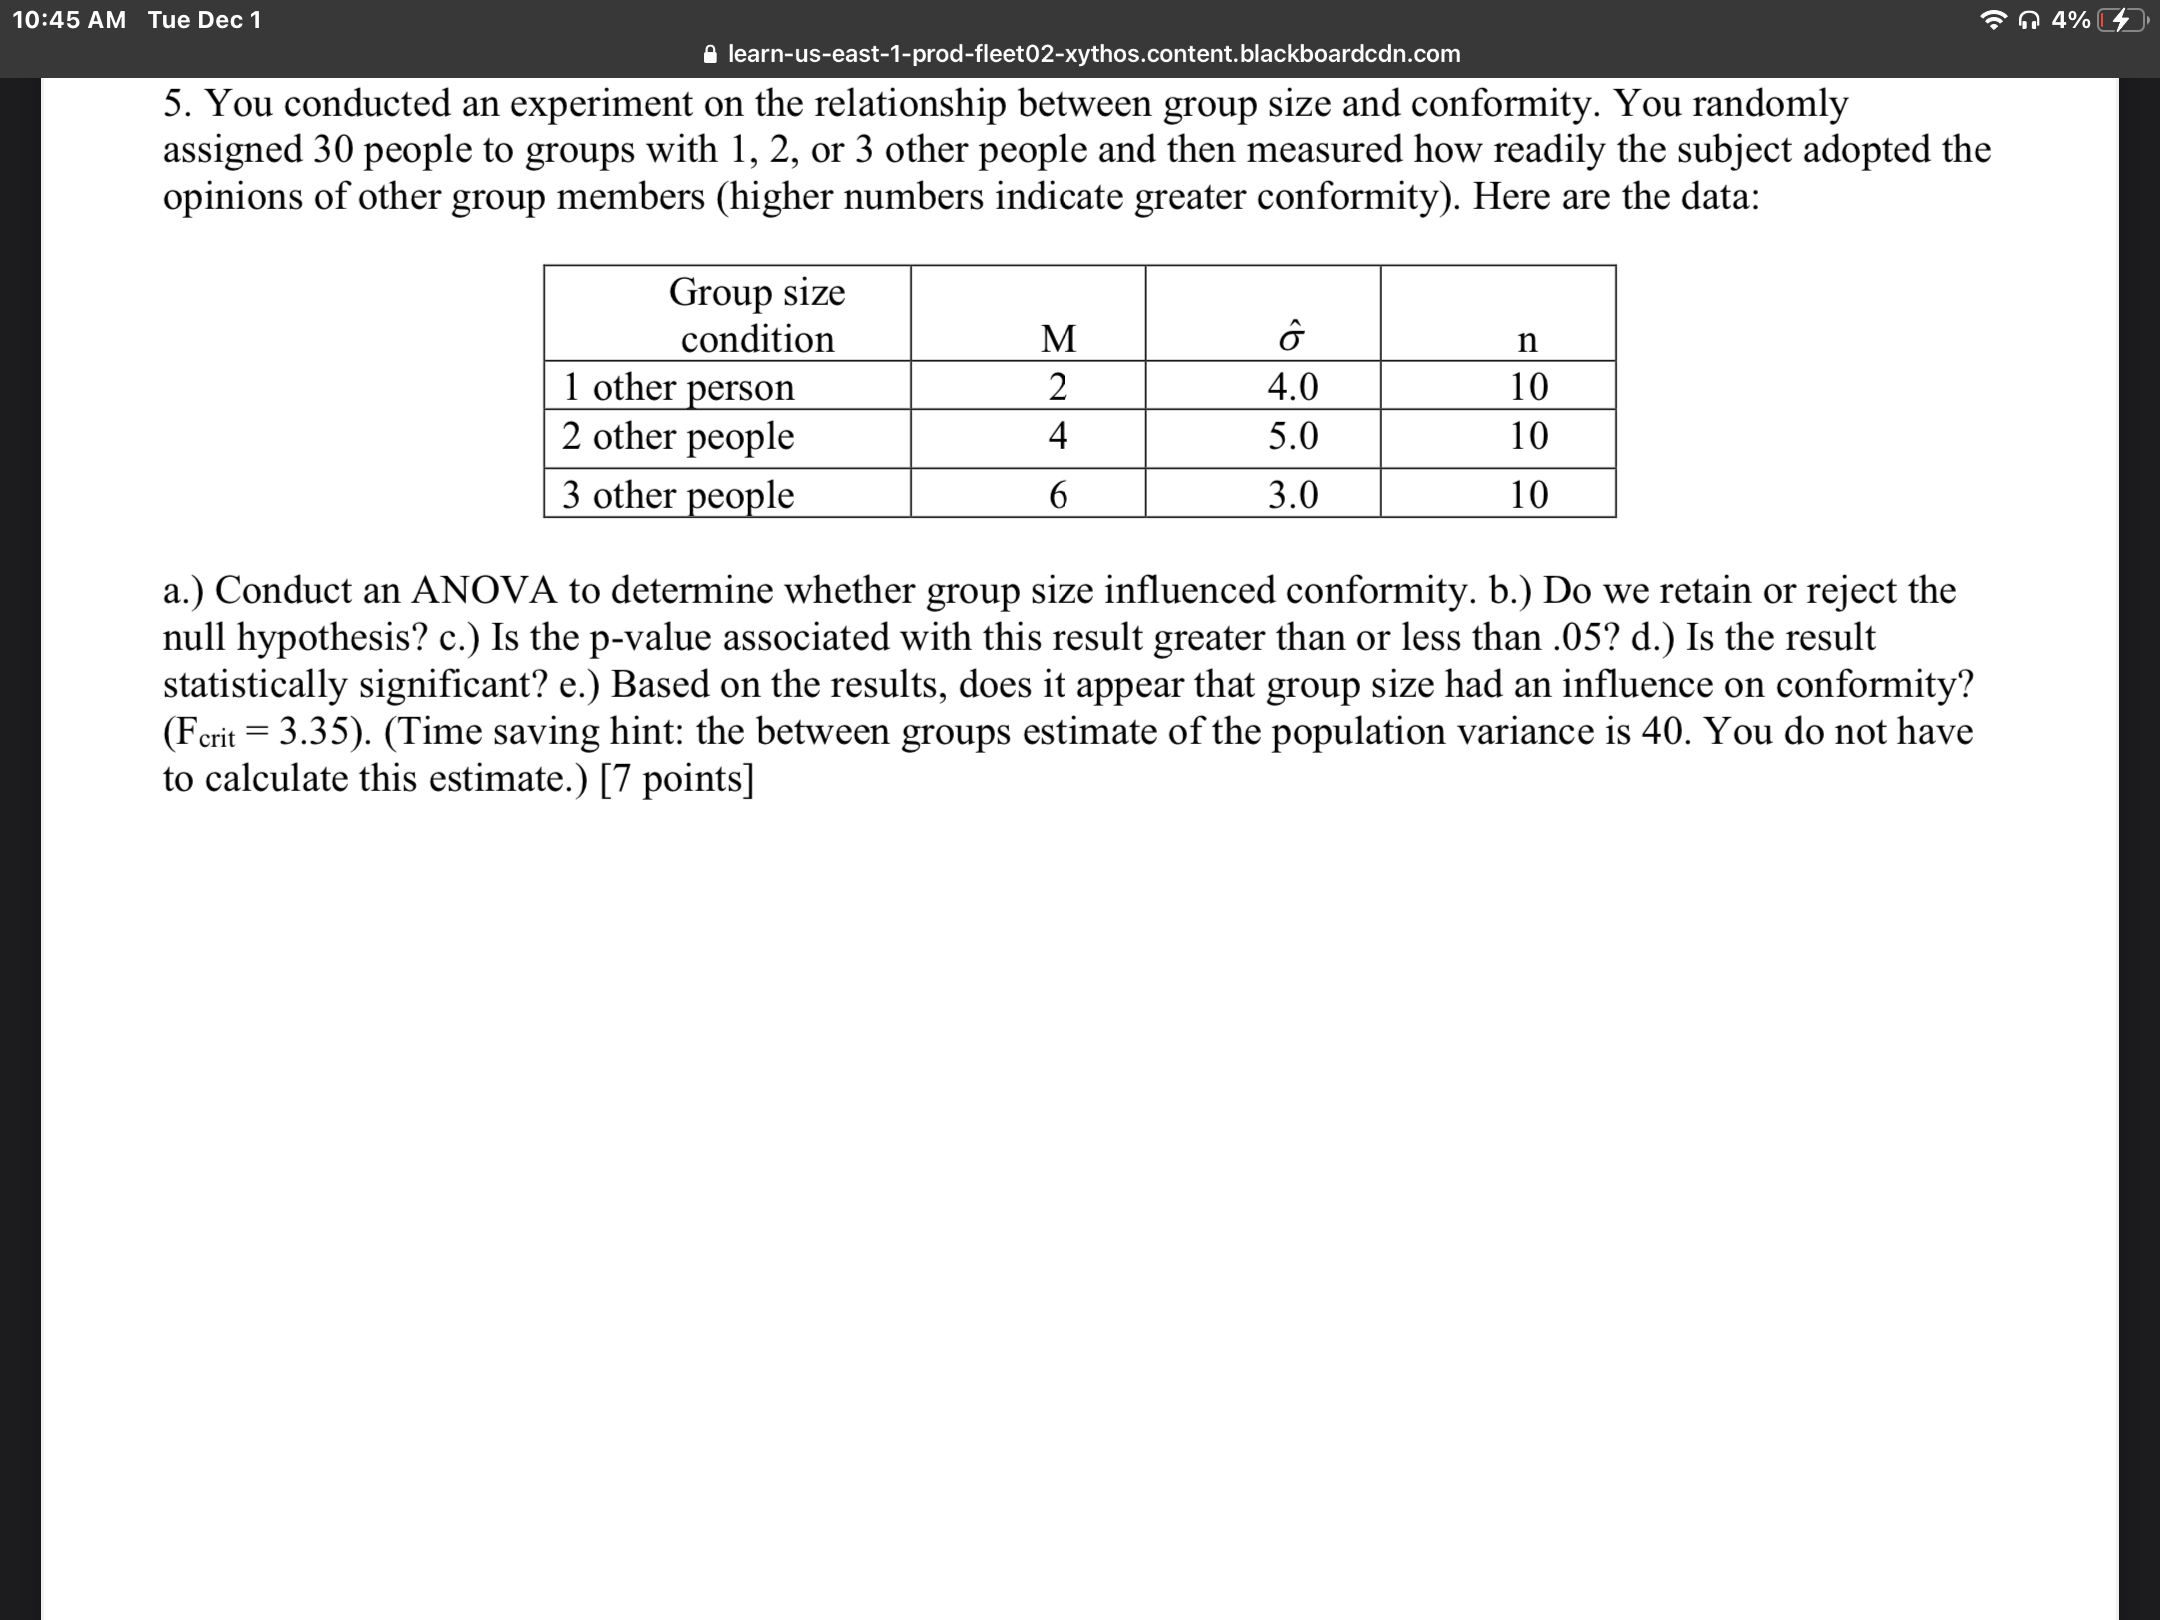
Show work for a better understanding 10:45 AM Tue Dec1 learnus-east1-prod-f|eet02xythos.content.blackboardcdn.com 5. You conducted an experiment on the relationship between group size and conformity. You

Show work for a better understanding

image text in transcribed
10:45 AM Tue Dec1 learnus-east1-prod-f|eet02xythos.content.blackboardcdn.com 5. You conducted an experiment on the relationship between group size and conformity. You randomly assigned 30 people to groups with l, 2, or 3 other people and then measured how readily the subject adopted the opinions of other group members (higher numbers indicate greater conformity). Here are the data: Group size condition M 6 n I 1 other person 2 I 4.0 I 10 I 2 other people 4 I 5.0 I 10 I 3 other people 6 I 3.0 I 10 a.) Conduct an ANOVA to determine whether group size inuenced conformity. b.) Do we retain or reject the null hypothesis? c.) Is the p-value associated with this result greater than or less than .05? d.) Is the result statistically signicant? e.) Based on the results, does it appear that group size had an inuence on conformity? (F crit = 3.35). (Time saving hint: the between groups estimate of the population variance is 40. You do not have to calculate this estimate.) [7 points]

Step by Step Solution

There are 3 Steps involved in it

Step: 1

blur-text-image

Get Instant Access to Expert-Tailored Solutions

See step-by-step solutions with expert insights and AI powered tools for academic success

Step: 2

blur-text-image

Step: 3

blur-text-image

Ace Your Homework with AI

Get the answers you need in no time with our AI-driven, step-by-step assistance

Get Started

Recommended Textbook for

A First Course in Differential Equations with Modeling Applications

Authors: Dennis G. Zill

11th edition

1305965728, 978-1305965720

More Books

Students also viewed these Mathematics questions