 Show work of calculations
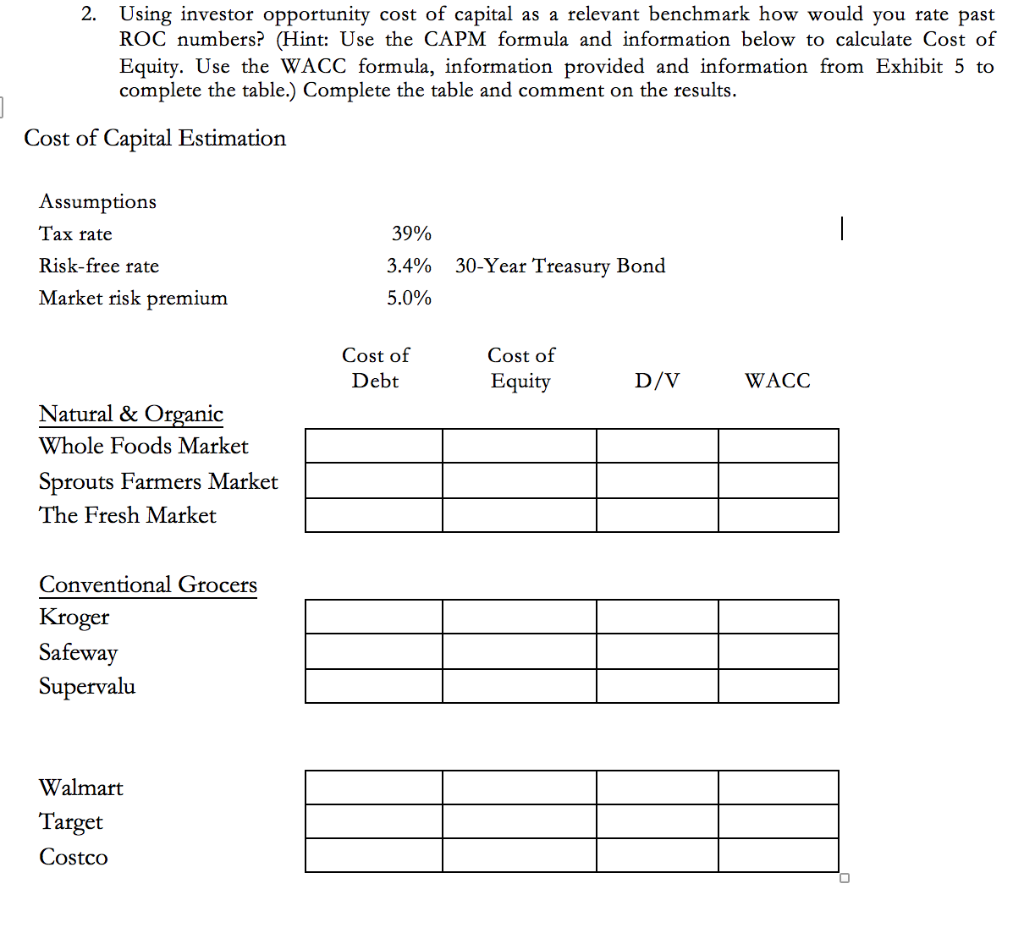
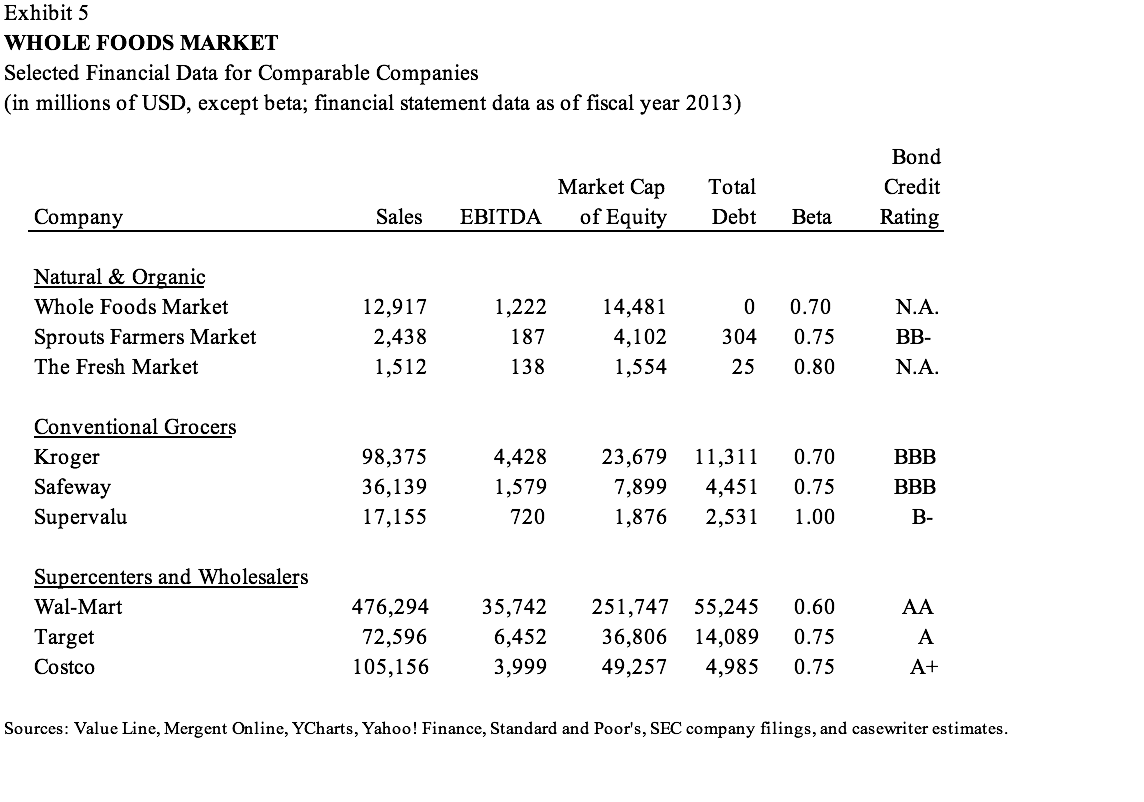
2. Using investor opportunity cost of capital as a relevant benchmark how would you rate past ROC numbers? (Hint: Use the CAPM formula and information below to calculate Cost of Equity. Use the WACC formula, information provided and information from Exhibit 5 to complete the table.) Complete the table and comment on the results. Cost of Capital Estimation Assumptions Tax rate Risk-free rate Market risk premium 39% 3.4% 5.0% 30-Year Treasury Bond Cost of Debt Cost of Equity D/V WACC Natural & Organic Whole Foods Market Sprouts Farmers Market The Fresh Market Conventional Grocers Kroger Safeway Supervalu Walmart Target Costco Exhibit 5 WHOLE FOODS MARKET Selected Financial Data for Comparable Companies (in millions of USD, except beta; financial statement data as of fiscal year 2013) Market Cap of Equity Total Debt Bond Credit Rating Company Sales EBITDA Beta 1,222 Natural & Organic Whole Foods Market Sprouts Farmers Market The Fresh Market 12,917 2,438 1,512 187 14,481 4,102 1,554 0 304 25 0.70 0.75 0.80 N.A. BB- N.A. 138 Conventional Grocers Kroger Safeway Supervalu 98,375 36,139 17,155 4,428 1,579 720 23,679 7,899 1,876 11,311 4,451 2,531 0.70 0.75 1.00 BBB BBB B- AA Supercenters and Wholesalers Wal-Mart Target Costco 476,294 72,596 105,156 35,742 6,452 3,999 251,747 55,245 36,806 14,089 49,257 4,985 0.60 0.75 0.75 A A+ Sources: Value Line, Mergent Online, YCharts, Yahoo! Finance, Standard and Poor's, SEC company filings, and casewriter estimates. 2. Using investor opportunity cost of capital as a relevant benchmark how would you rate past ROC numbers? (Hint: Use the CAPM formula and information below to calculate Cost of Equity. Use the WACC formula, information provided and information from Exhibit 5 to complete the table.) Complete the table and comment on the results. Cost of Capital Estimation Assumptions Tax rate Risk-free rate Market risk premium 39% 3.4% 5.0% 30-Year Treasury Bond Cost of Debt Cost of Equity D/V WACC Natural & Organic Whole Foods Market Sprouts Farmers Market The Fresh Market Conventional Grocers Kroger Safeway Supervalu Walmart Target Costco Exhibit 5 WHOLE FOODS MARKET Selected Financial Data for Comparable Companies (in millions of USD, except beta; financial statement data as of fiscal year 2013) Market Cap of Equity Total Debt Bond Credit Rating Company Sales EBITDA Beta 1,222 Natural & Organic Whole Foods Market Sprouts Farmers Market The Fresh Market 12,917 2,438 1,512 187 14,481 4,102 1,554 0 304 25 0.70 0.75 0.80 N.A. BB- N.A. 138 Conventional Grocers Kroger Safeway Supervalu 98,375 36,139 17,155 4,428 1,579 720 23,679 7,899 1,876 11,311 4,451 2,531 0.70 0.75 1.00 BBB BBB B- AA Supercenters and Wholesalers Wal-Mart Target Costco 476,294 72,596 105,156 35,742 6,452 3,999 251,747 55,245 36,806 14,089 49,257 4,985 0.60 0.75 0.75 A A+ Sources: Value Line, Mergent Online, YCharts, Yahoo! Finance, Standard and Poor's, SEC company filings, and casewriter estimates

 Show work of calculations


