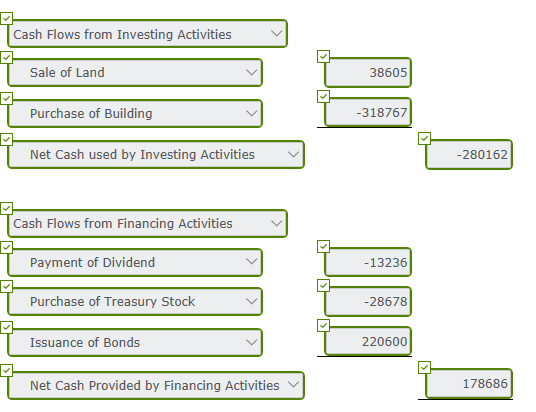
Answered step by step
Verified Expert Solution
Question
1 Approved Answer
Shown below are comparative balance sheets for Waterway Industries Waterway Industries Comparative Balance Sheets December 31 Asset Cash Accounts receivable Inventory Land Equipment Accumulated depreciation-equipment
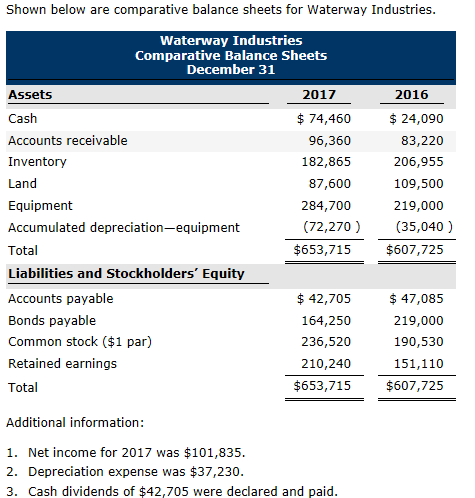
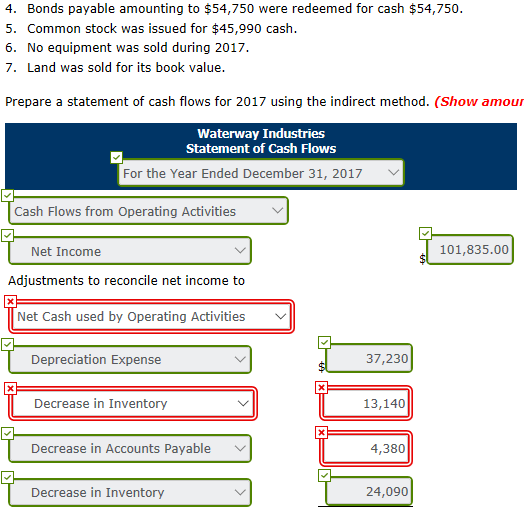
Shown below are comparative balance sheets for Waterway Industries Waterway Industries Comparative Balance Sheets December 31 Asset Cash Accounts receivable Inventory Land Equipment Accumulated depreciation-equipment Total Liabilities and Stockholders' Equity Accounts payable Bonds payable Common stock ($1 par) Retained earnings Total 2017 2016 $ 74,460 96,360 182,865 87,600 284,700 $ 24,090 83,220 206,955 109,500 219,000 (72,270)(35,040) $653,715 $607,725 42,705 164,250 236,520 210,240 $653,715 $47,085 219,000 190,530 151,110 $607,725 Additional information: 1. Net income for 2017 was $101,835 2. Depreciation expense was $37,230 3. Cash dividends of $42,705 were declared and paid
Step by Step Solution
There are 3 Steps involved in it
Step: 1
Get Instant Access to Expert-Tailored Solutions
See step-by-step solutions with expert insights and AI powered tools for academic success
Step: 2
Step: 3
Ace Your Homework with AI
Get the answers you need in no time with our AI-driven, step-by-step assistance
Get Started