

Answered step by step
Verified Expert Solution
Question
1 Approved Answer
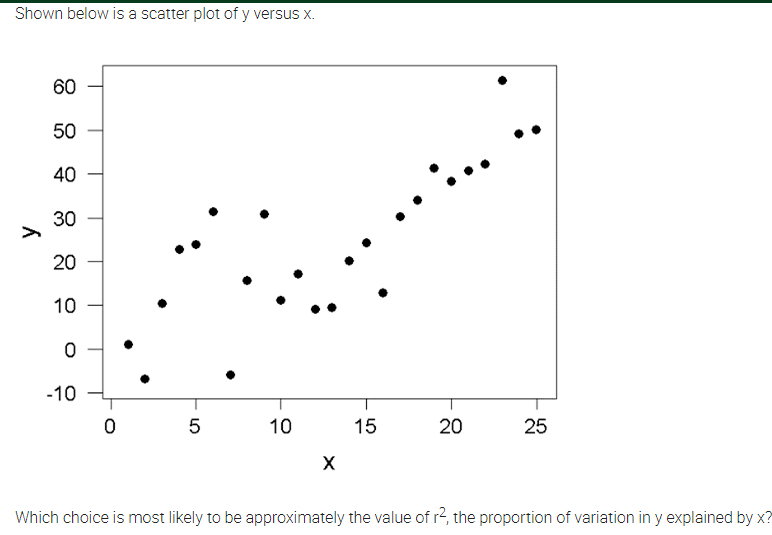
Shown below is a scatter plot of y versus x. 60 50 40 30 20 10 0 -10 0 5 10 15 20 25 X


Step by Step Solution
There are 3 Steps involved in it
Step: 1

Get Instant Access to Expert-Tailored Solutions
See step-by-step solutions with expert insights and AI powered tools for academic success
Step: 2

Step: 3
Ace Your Homework with AI
Get the answers you need in no time with our AI-driven, step-by-step assistance
Get Started
Elementary Linear Programming With Applications
Authors: Bernard Kolman, Robert E Beck
2nd Edition
0080530796, 9780080530796