Answered step by step
Verified Expert Solution
Question
1 Approved Answer
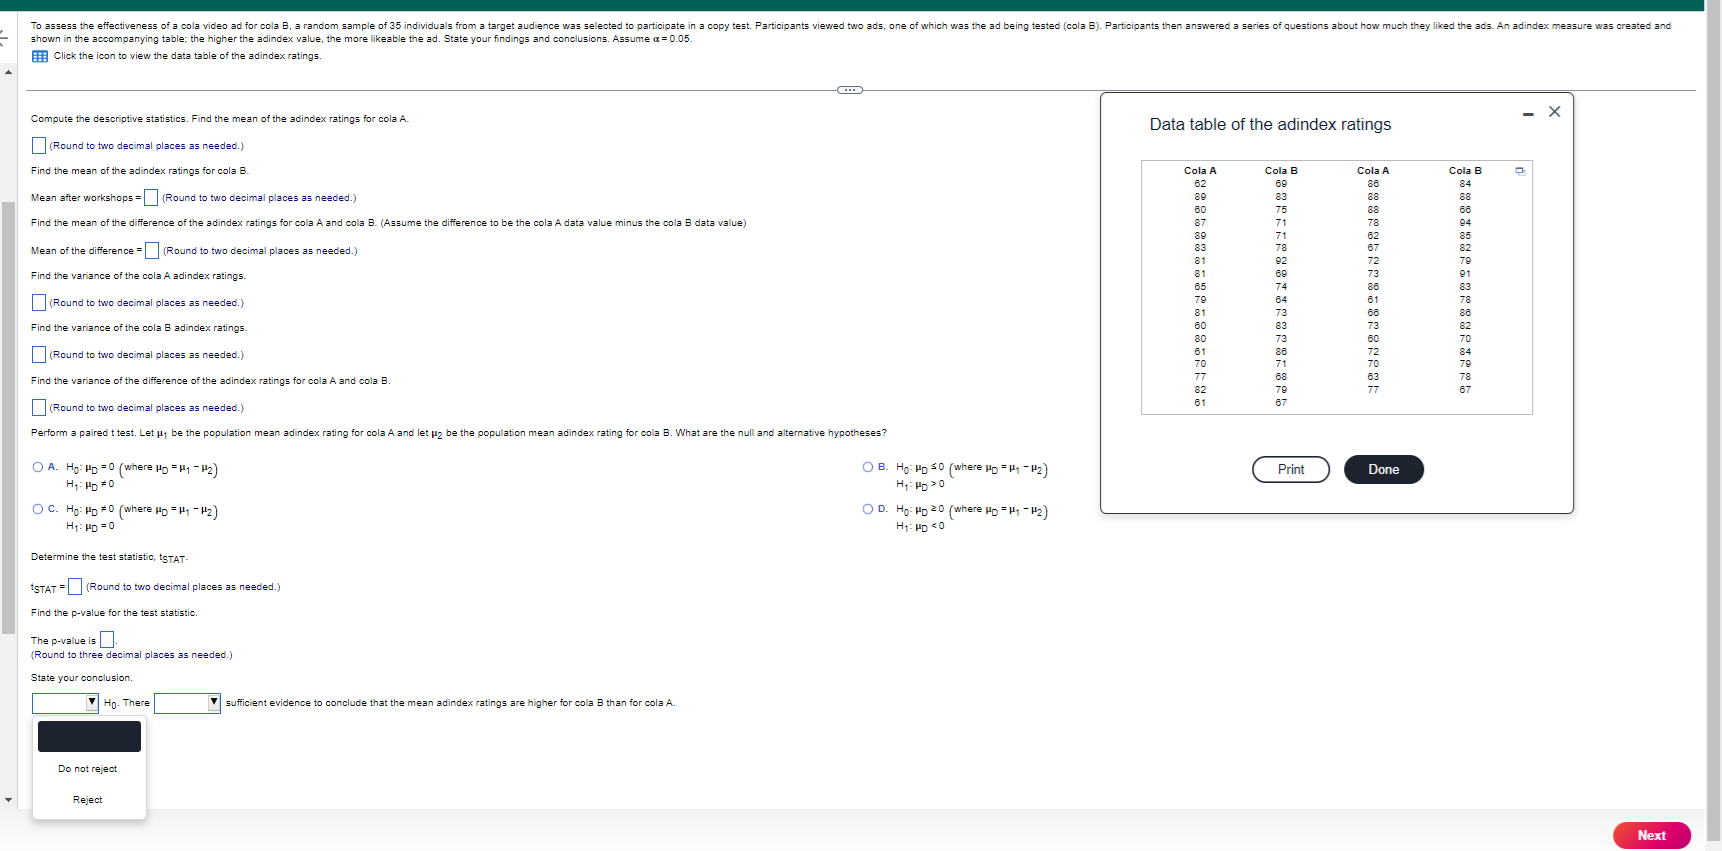
shown in the accompanying table; the higher the adindex value, the more likeable the ad . State your findings and conclusions. Assume = 0 .
shown in the accompanying table; the higher the adindex value, the more likeable the ad State your findings and conclusions. Assume
Compute the descriptive statistics. Find the mean of the adindex ratings for cola A
Round to two decimal places as needed.
Find the mean of the adindex ratings for cola B
Mean after workshops Round to two decimal places as needed.
Find the mean of the difference of the adindex ratings for cola A and cola BAssume the difference to be the cola A data value minus the cola B data value
Mean of the difference Round to two decimal places as needed.
Find the variance of the cola A adindex ratings.
Round to two decimal places as needed.
Find the variance of the cola adindex ratings.
Round to two decimal places as needed.
Find the variance of the difference of the adindex ratings for cola A and cola B
Round to two decimal places as needed.
Perform a paired t test. Let be the population mean adindex rating for cola A and let be the population mean adindex rating for cola What are the null and alternative hypotheses?
A
where
C:
:where :
:
Determine the test statistic, tSTAT.
Find the pvalue for the test statistic.
The pvalue is
Round to three decimal places as needed.
State your conclusion.
There
There
Do not reject
Reject
B where ::
D:where :
Data table of the adindex ratings
tableCola ACola BCola ACola B
Print
Done

Step by Step Solution
There are 3 Steps involved in it
Step: 1

Get Instant Access to Expert-Tailored Solutions
See step-by-step solutions with expert insights and AI powered tools for academic success
Step: 2

Step: 3

Ace Your Homework with AI
Get the answers you need in no time with our AI-driven, step-by-step assistance
Get Started


