Question
Shown in the table is the income of an individual with corresponding unit of good the person can purchase. Fill in the blanks and


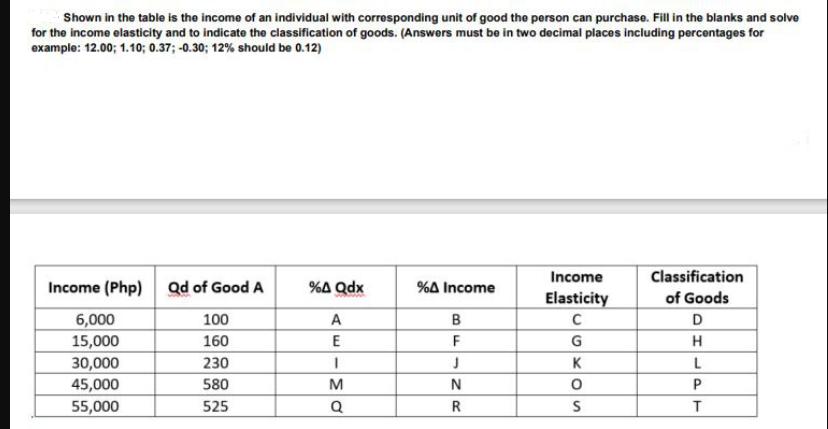
Shown in the table is the income of an individual with corresponding unit of good the person can purchase. Fill in the blanks and solve for the income elasticity and to indicate the classification of goods. (Answers must be in two decimal places including percentages for example: 12.00; 1.10; 0.37; -0.30; 12% should be 0.12) Income (Php) Qd of Good A 6,000 15,000 30,000 45,000 55,000 100 160 230 580 525 %A Qdx A E 1 M Q % Income B F J N R Income Elasticity C G K O S Classification of Goods D H L P T 41. What is the amount of F? 42. What is L? a. Normal Good b. Inferior Good c. Abnormal Good d. None of the Above 43. What is the amount of M? 44. What is the amount of S? 45. What is T? a. Normal Good b. Inferior Good c. Abnormal Good d. None of the Above
Step by Step Solution
3.58 Rating (155 Votes )
There are 3 Steps involved in it
Step: 1

Get Instant Access to Expert-Tailored Solutions
See step-by-step solutions with expert insights and AI powered tools for academic success
Step: 2

Step: 3

Ace Your Homework with AI
Get the answers you need in no time with our AI-driven, step-by-step assistance
Get StartedRecommended Textbook for
Intermediate Financial Management
Authors: Eugene F. Brigham, Phillip R. Daves
11th edition
978-1111530266
Students also viewed these Economics questions
Question
Answered: 1 week ago
Question
Answered: 1 week ago
Question
Answered: 1 week ago
Question
Answered: 1 week ago
Question
Answered: 1 week ago
Question
Answered: 1 week ago
Question
Answered: 1 week ago
Question
Answered: 1 week ago
Question
Answered: 1 week ago
Question
Answered: 1 week ago
Question
Answered: 1 week ago
Question
Answered: 1 week ago
Question
Answered: 1 week ago
Question
Answered: 1 week ago
Question
Answered: 1 week ago
Question
Answered: 1 week ago
Question
Answered: 1 week ago
Question
Answered: 1 week ago
Question
Answered: 1 week ago
Question
Answered: 1 week ago
Question
Answered: 1 week ago
Question
Answered: 1 week ago
Question
Answered: 1 week ago
Question
Answered: 1 week ago
View Answer in SolutionInn App


