Answered step by step
Verified Expert Solution
Link Copied!

Question

1 Approved Answer

shows historical yields for U.S. savings bonds between 2005 and 2016. Calculate the average yield for both bonds over the time period. (Round answers to

shows historical yields for U.S. savings bonds between 2005 and 2016.image text in transcribed
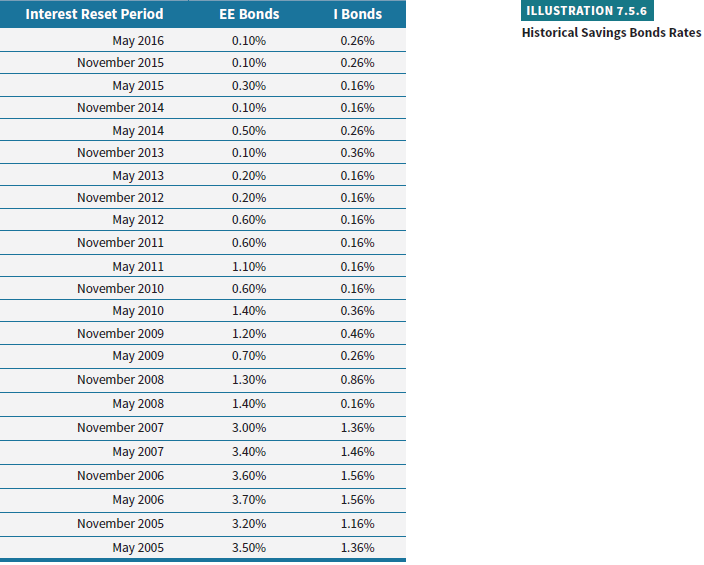
Calculate the average yield for both bonds over the time period. (Round answers to 2 decimal places, e.g. 5.27.)

EE bonds %
I bonds %

Which bondEE or Igenerated the highest yield over the time period?

EE bonds
I bonds
EE Bonds 0.10% 0.10% I Bonds 0.26% 0.26% ILLUSTRATION 7.5.6 Historical Savings Bonds Rates 0.30% 0.16% 0.10% 0.16% 0.50% 0.26% 0.10% 0.36% 0.20% 0.16% 0.20% 0.16% 0.60% 0.16% 0.60% 0.16% 1.10% 0.16% Interest Reset Period May 2016 November 2015 May 2015 November 2014 May 2014 November 2013 May 2013 November 2012 May 2012 November 2011 May 2011 November 2010 May 2010 November 2009 May 2009 November 2008 May 2008 November 2007 May 2007 November 2006 May 2006 November 2005 May 2005 0.60% 0.16% 1.40% 0.36% 1.20% 0.46% 0.70% 0.26% 1.30% 0.86% 1.40% 0.16% 3.00% 1.36% 3.40% 1.46% 3.60% 1.56% 3.70% 1.56% 3.209 1.16% 3.50% 1.36%

Step by Step Solution

There are 3 Steps involved in it

Step: 1

blur-text-image

Get Instant Access to Expert-Tailored Solutions

See step-by-step solutions with expert insights and AI powered tools for academic success

Step: 2

blur-text-image

Step: 3

blur-text-image

Ace Your Homework with AI

Get the answers you need in no time with our AI-driven, step-by-step assistance

Get Started

Recommended Textbook for

Raising Venture Capital

Authors: Rupert Pearce, Simon Barnes

1st Edition

0470027576, 978-0470027578

More Books

Students also viewed these Finance questions