Answered step by step
Verified Expert Solution
Question
1 Approved Answer
Simon Company's year-end balance sheets follow. At December 31 Assets Cash Accounts receivable, net Merchandise inventory Prepaid expenses Plant assets, net Total assets Liabilities
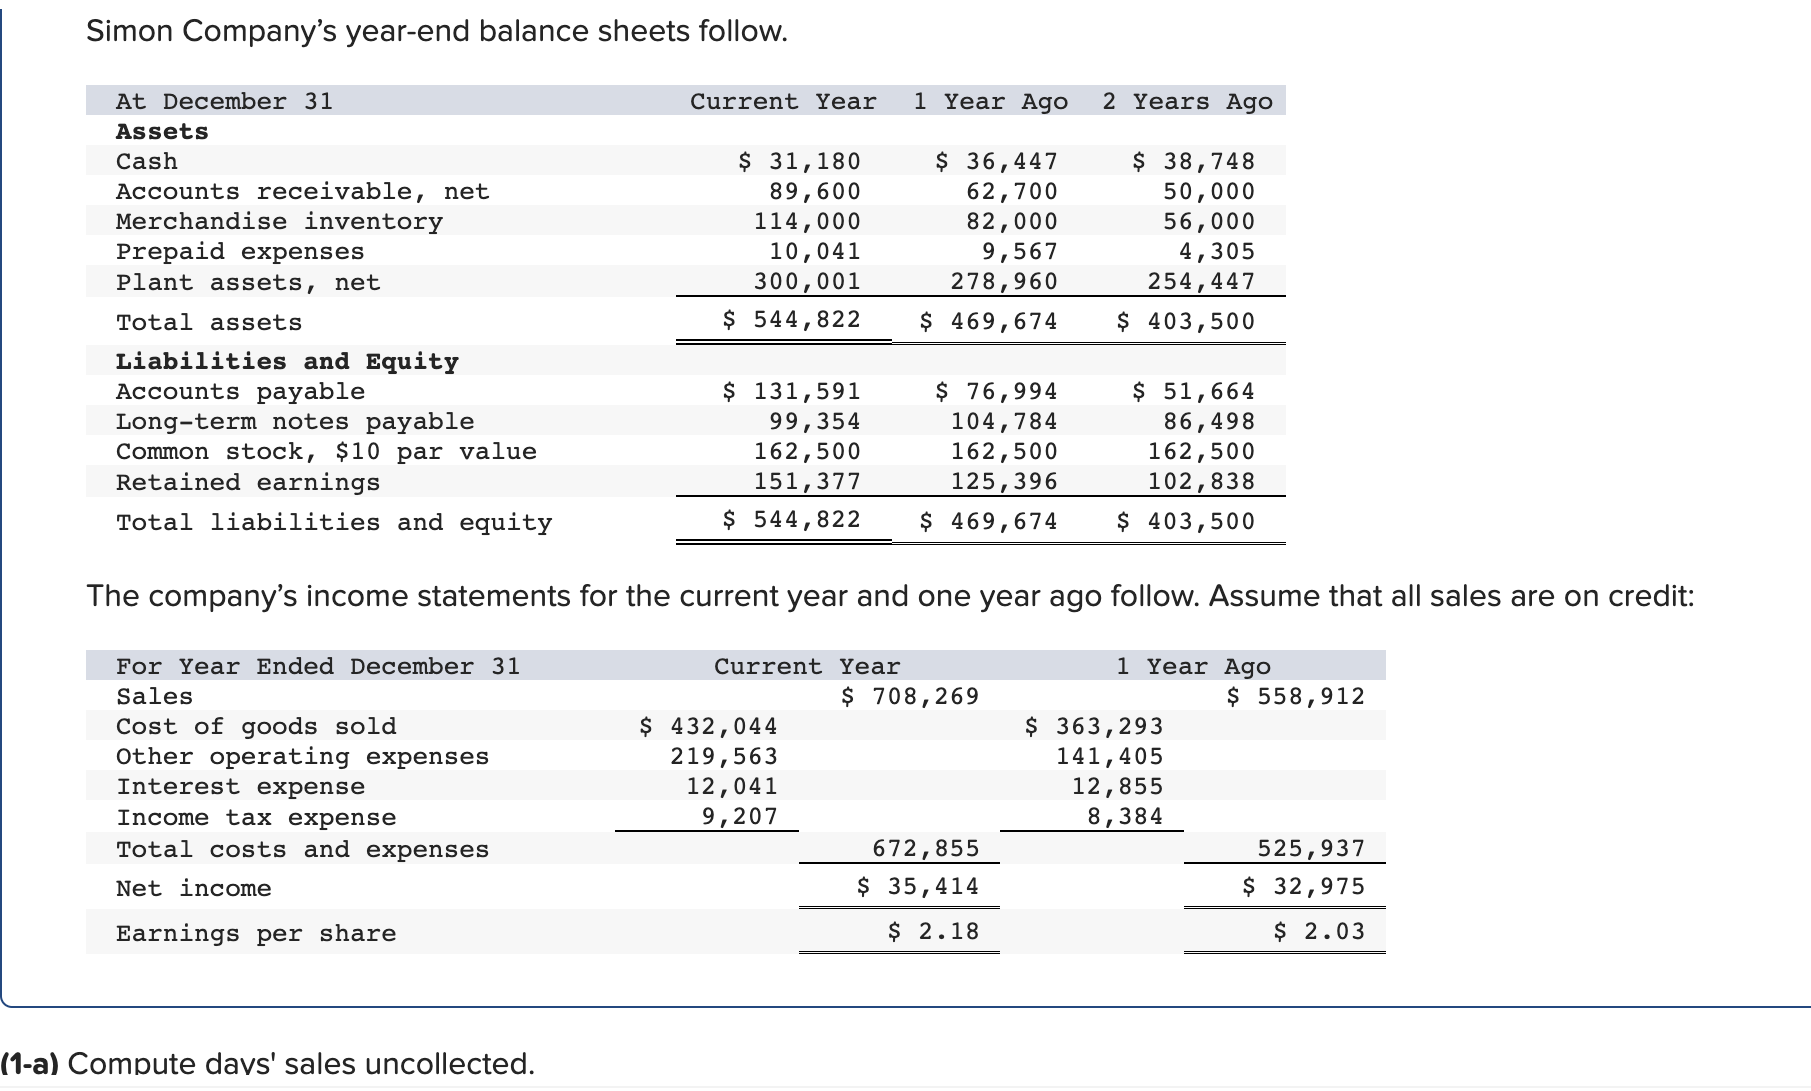
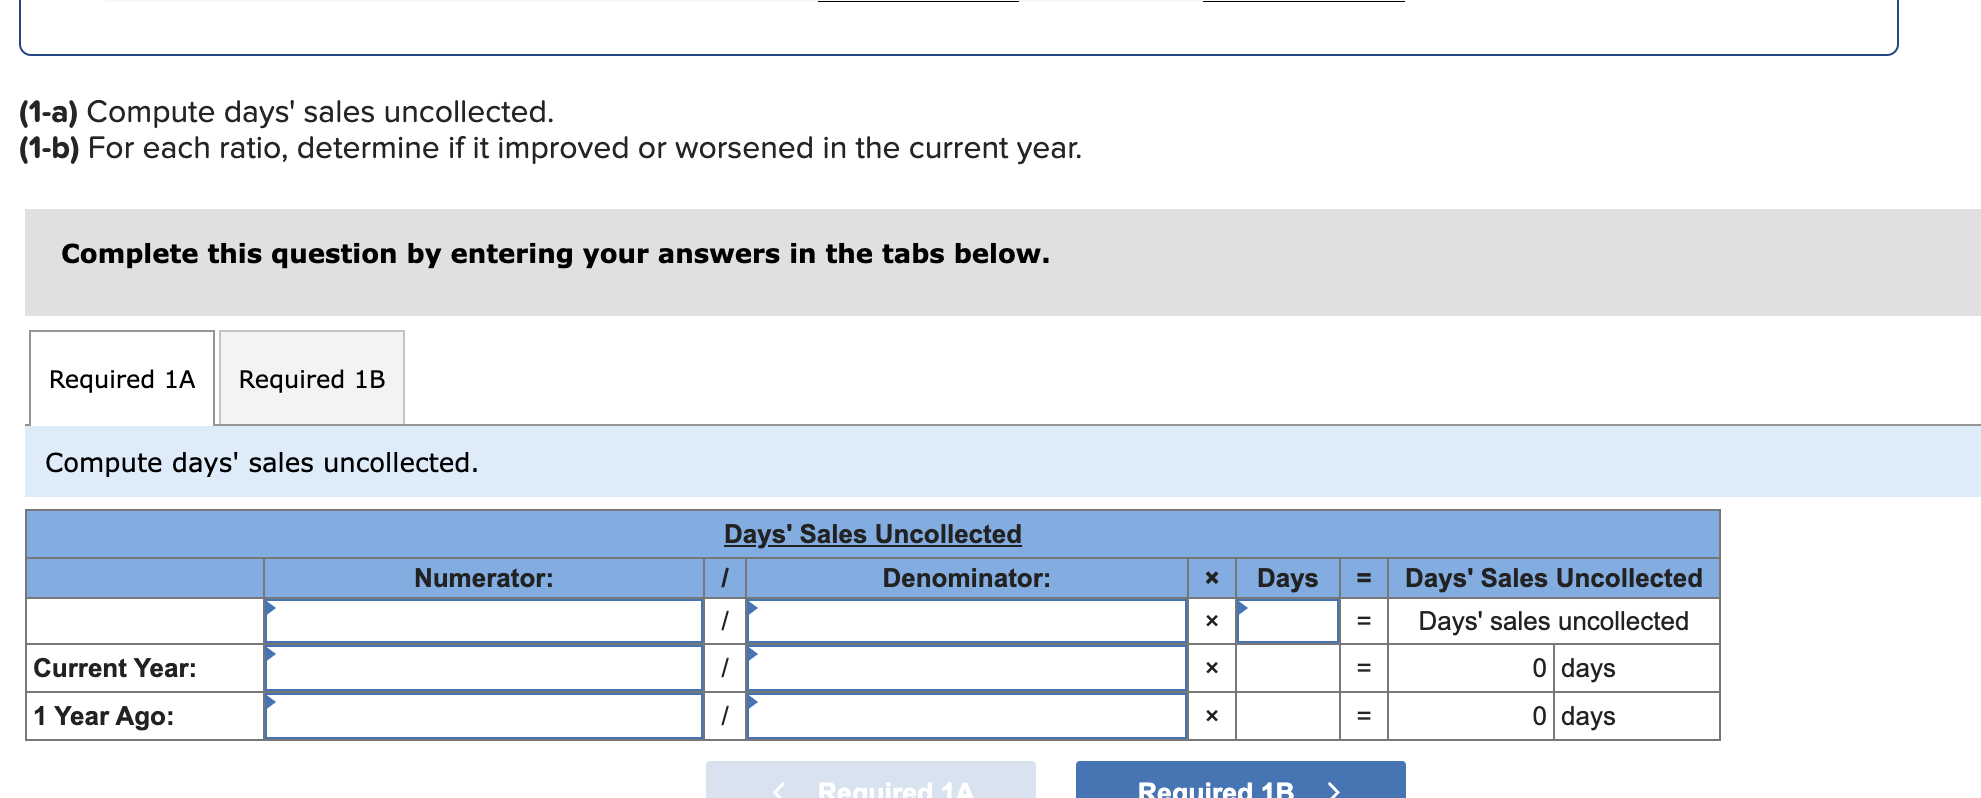
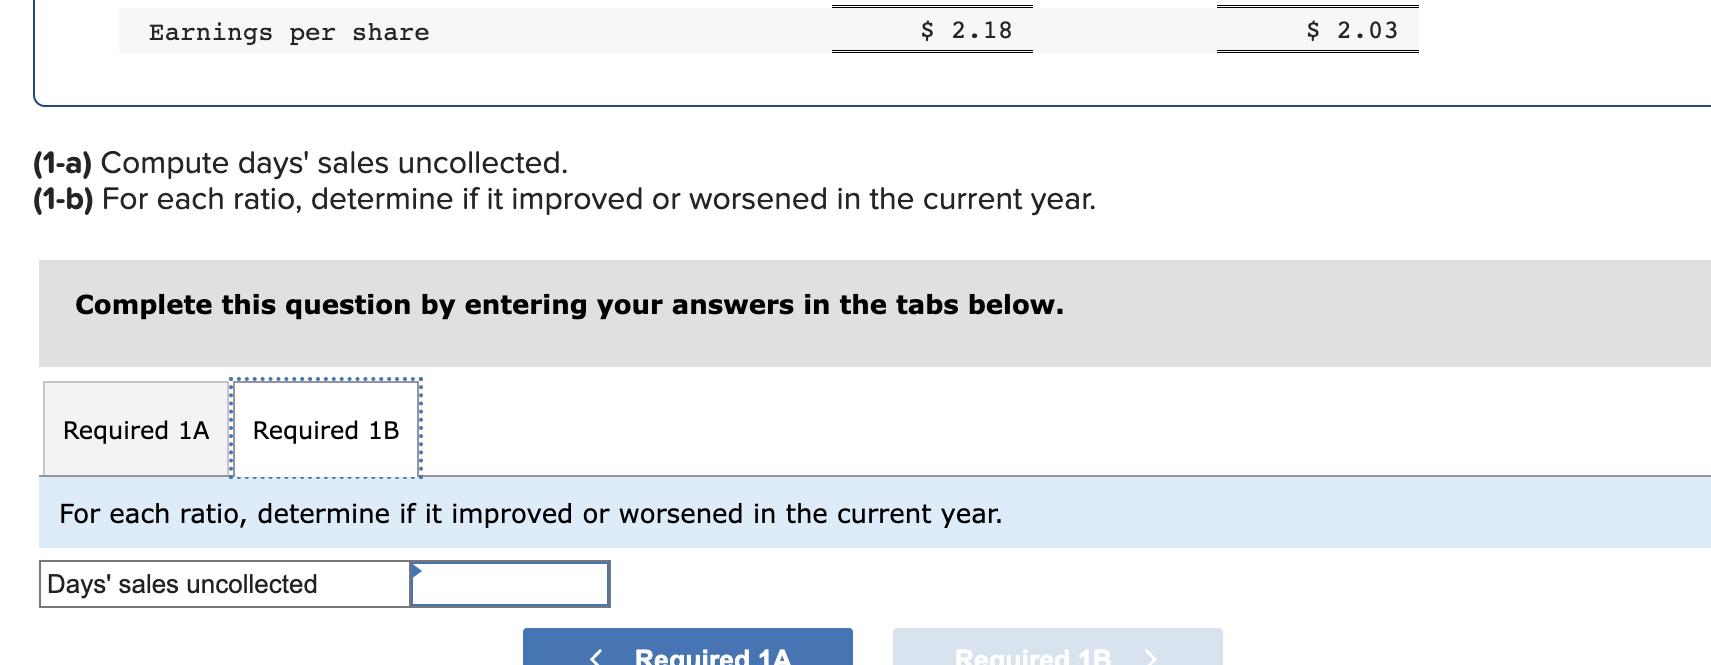
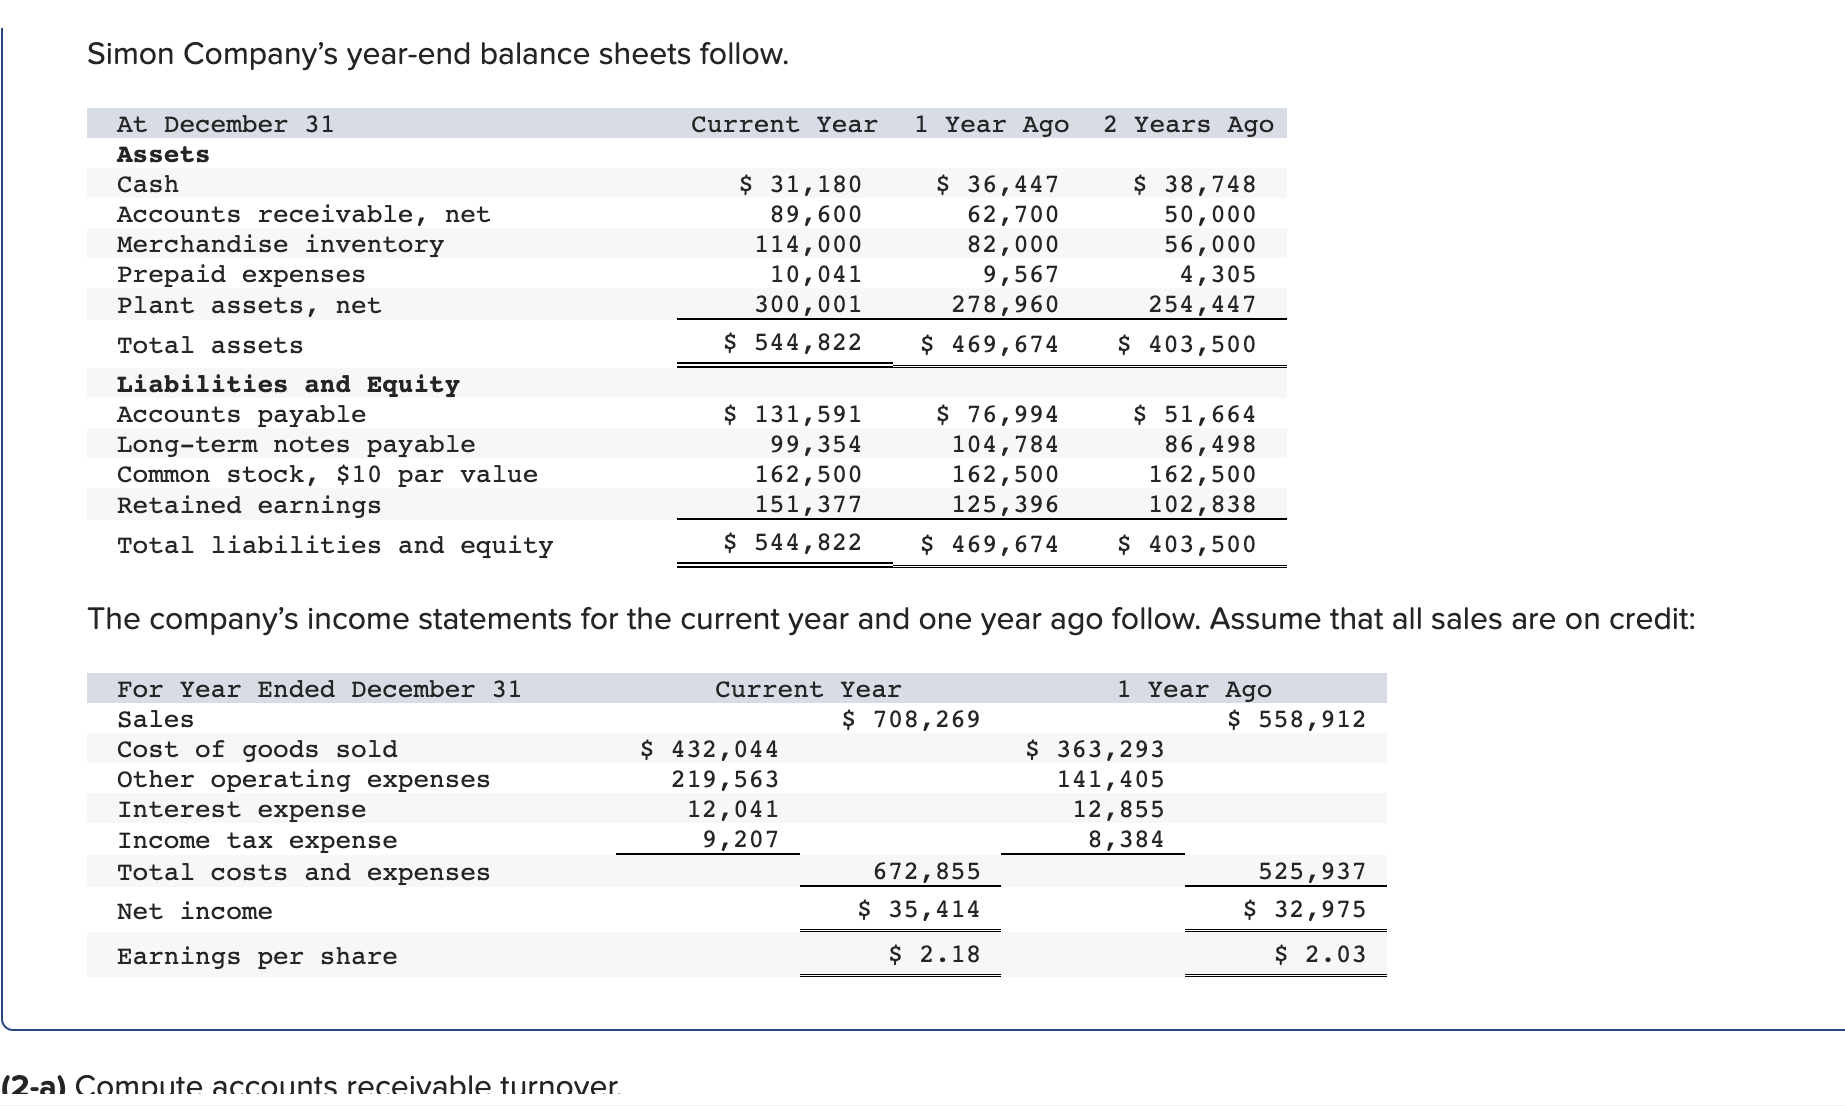
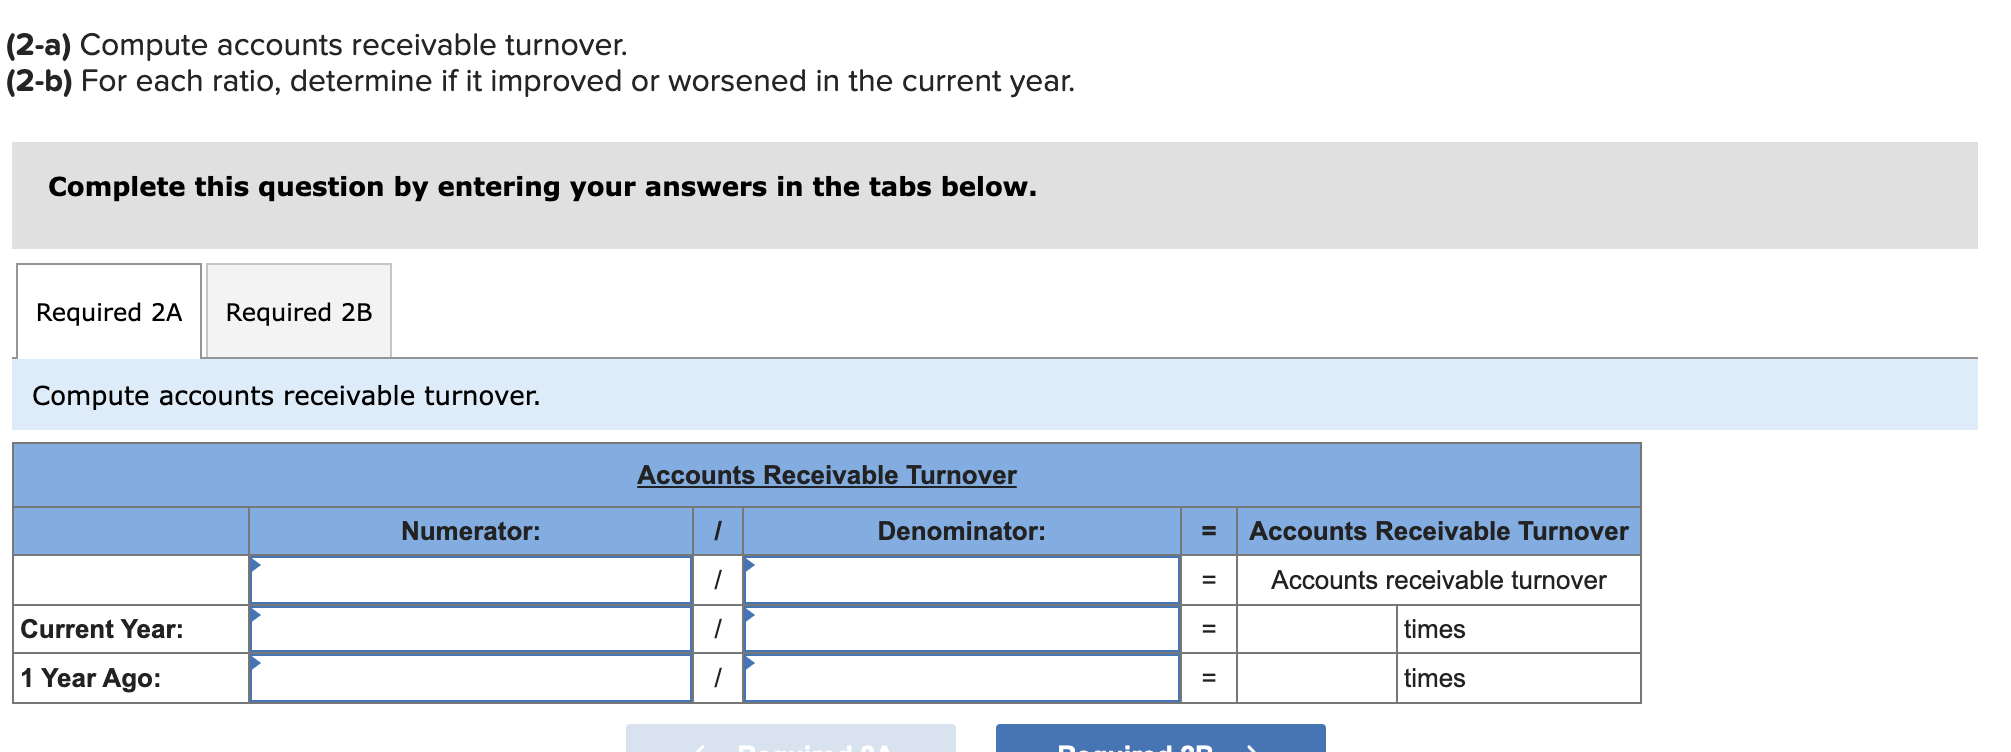
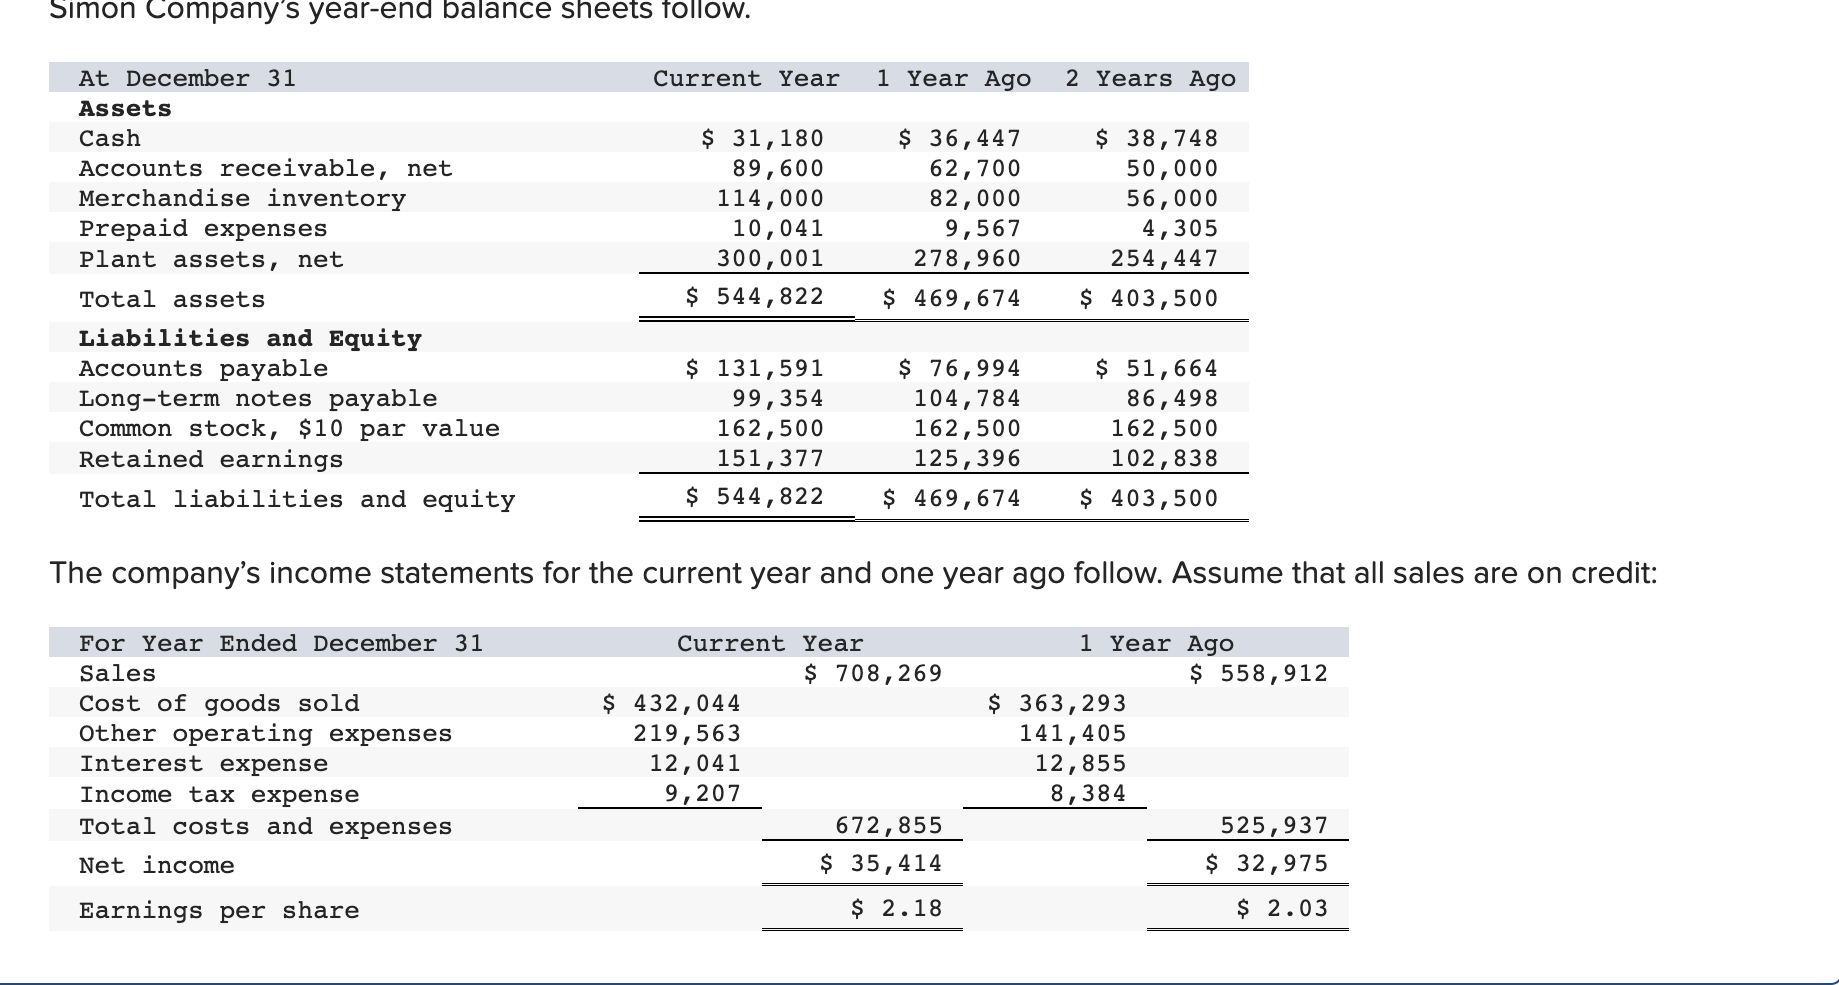
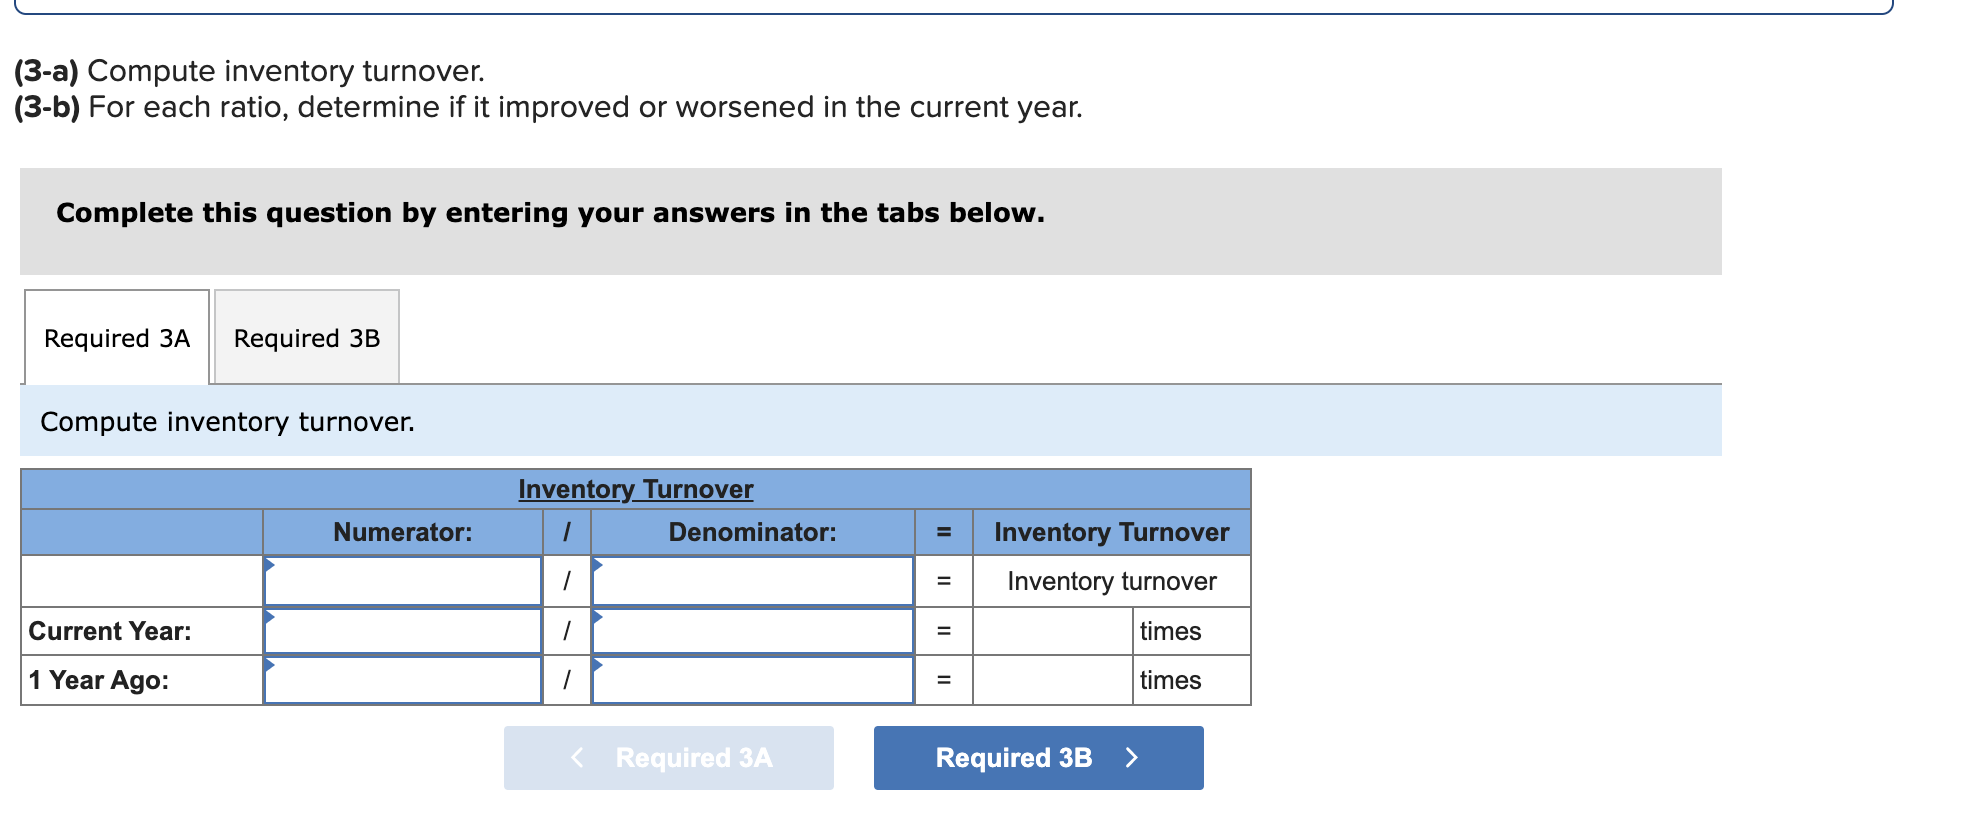
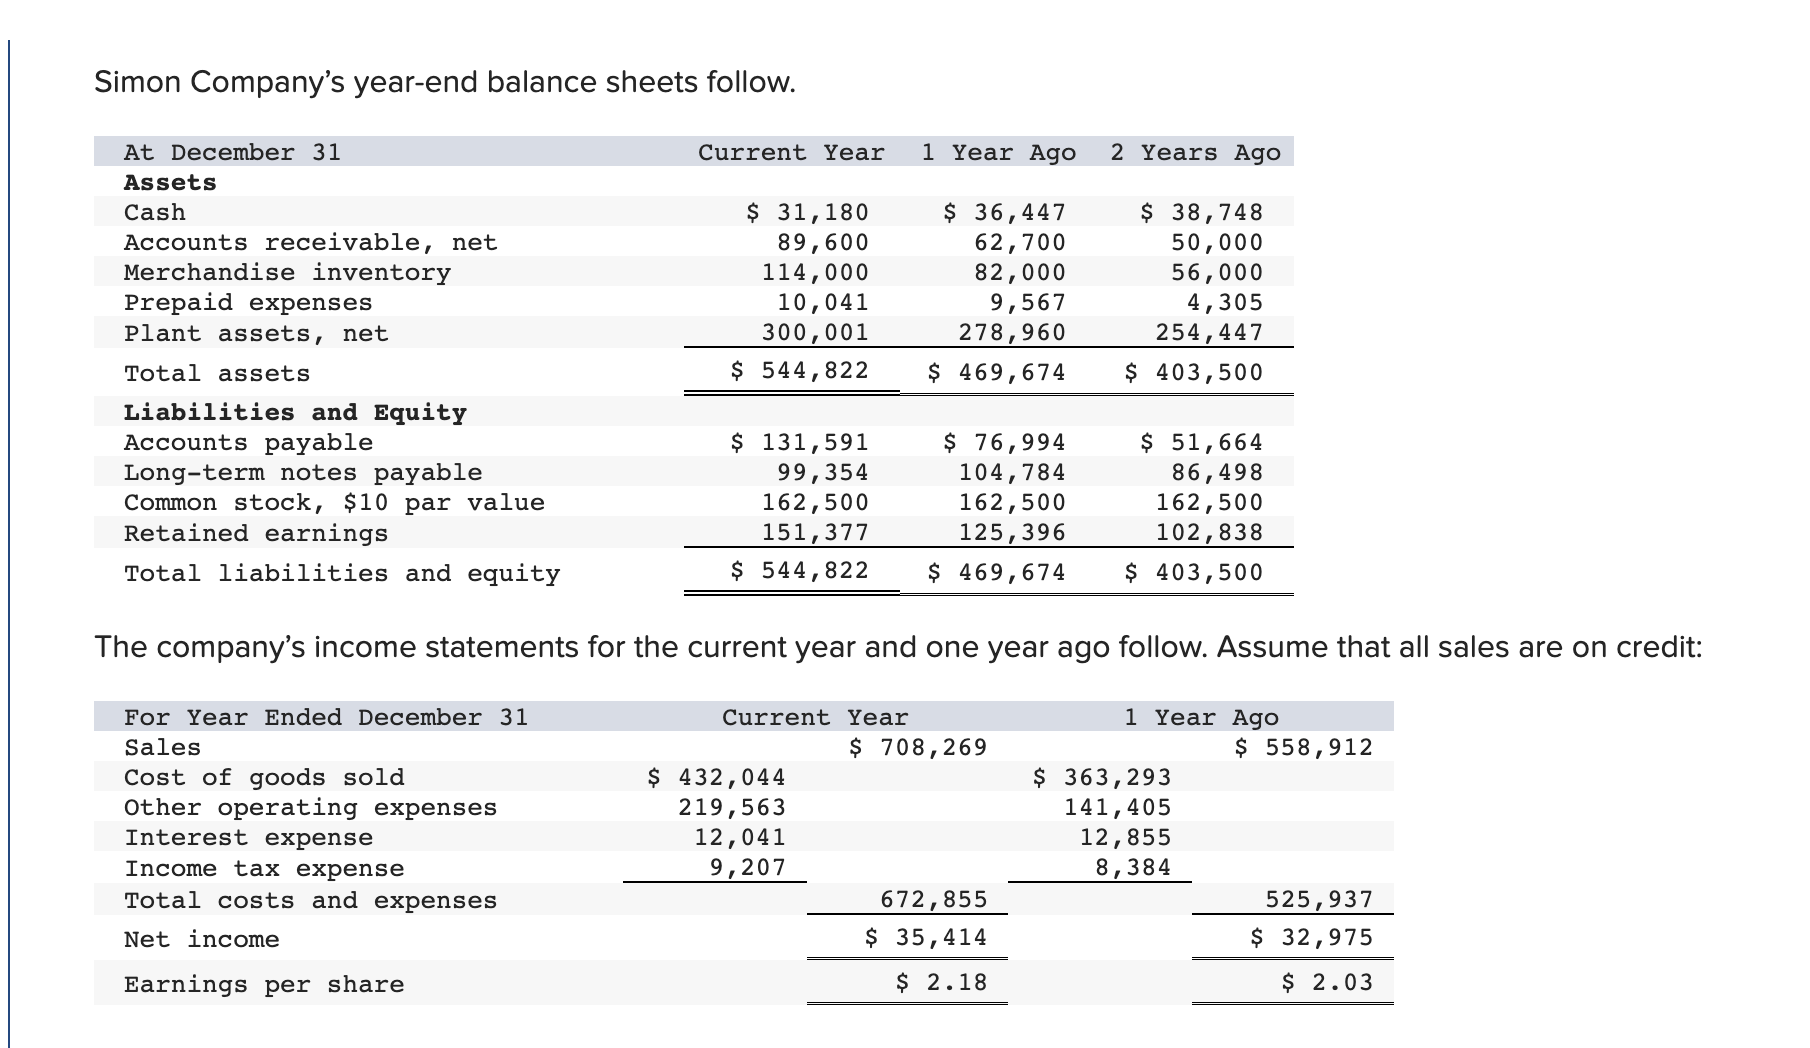
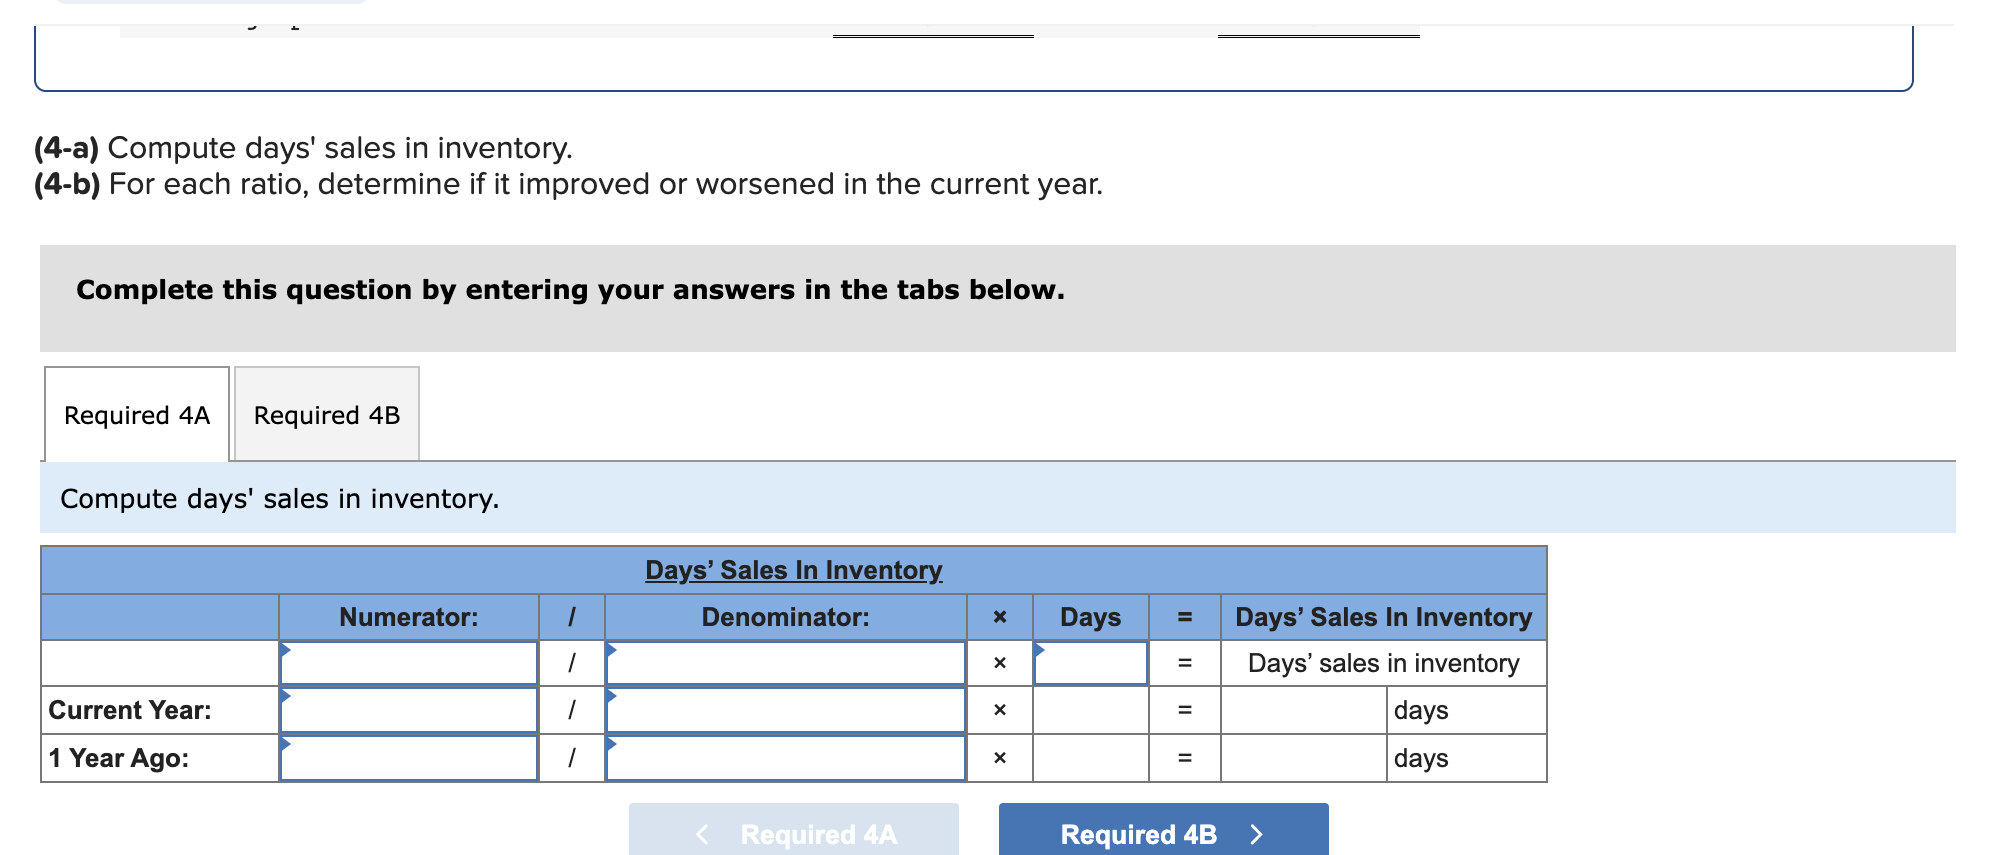
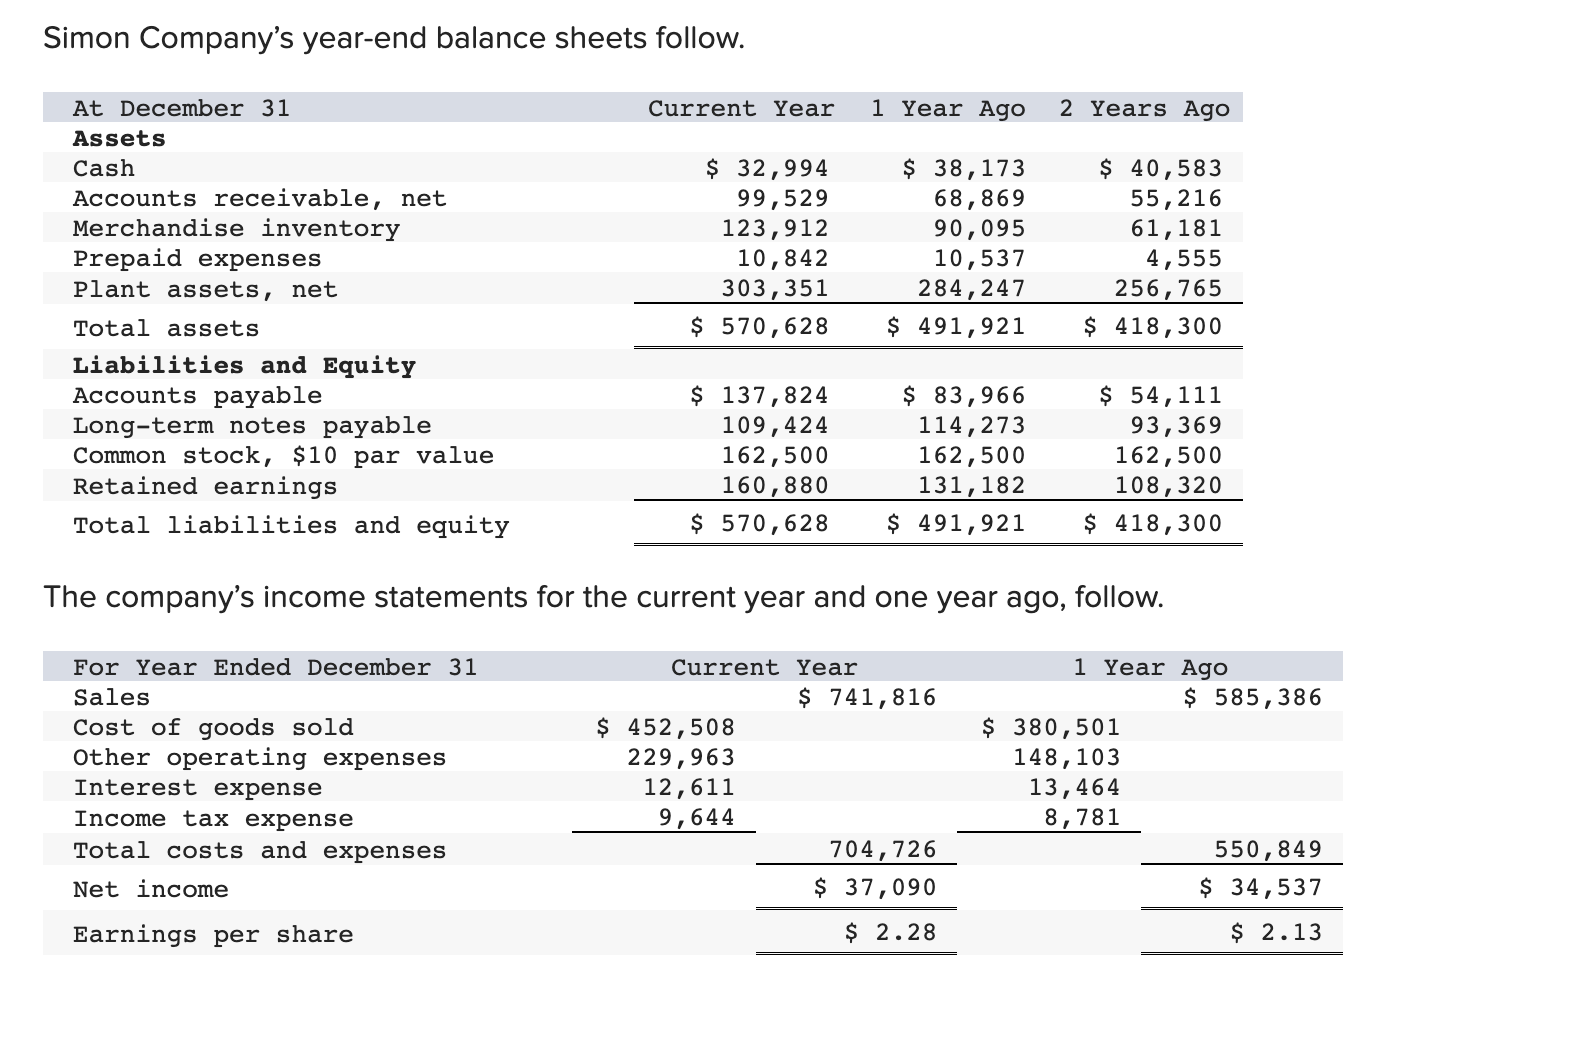
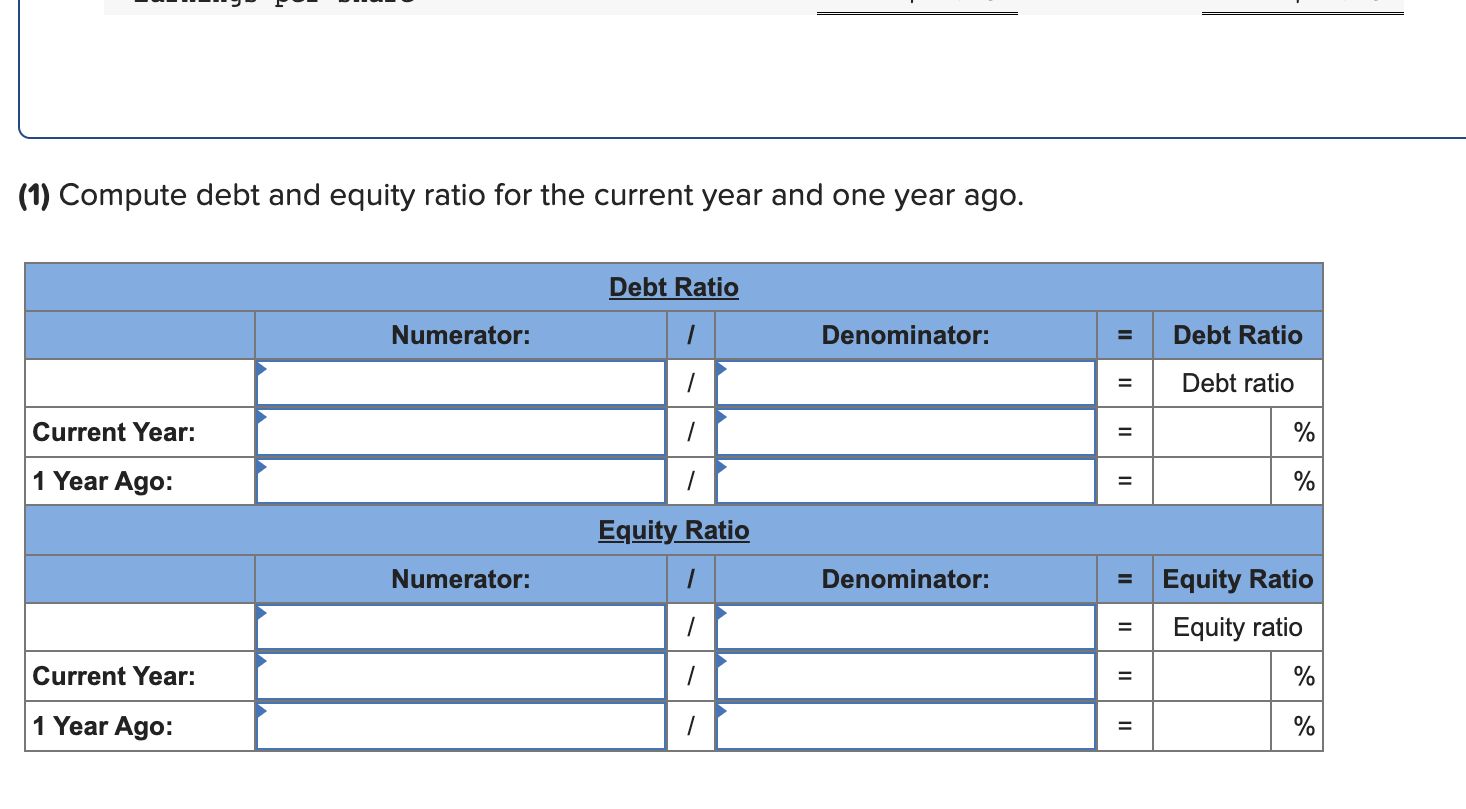
Simon Company's year-end balance sheets follow. At December 31 Assets Cash Accounts receivable, net Merchandise inventory Prepaid expenses Plant assets, net Total assets Liabilities and Equity Accounts payable Current Year 1 Year Ago 2 Years Ago $ 31,180 89,600 114,000 10,041 300,001 $ 544,822 $ 131,591 Long-term notes payable Common stock, $10 par value Retained earnings Total liabilities and equity 99,354 162,500 151,377 $ 544,822 $ 36,447 62,700 82,000 9,567 278,960 $ 469,674 $ 76,994 104,784 162,500 125,396 $ 469,674 $ 38,748 50,000 56,000 4,305 254,447 $ 403,500 $ 51,664 86,498 162,500 102,838 $ 403,500 The company's income statements for the current year and one year ago follow. Assume that all sales are on credit: For Year Ended December 31 Sales Cost of goods sold Other operating expenses Interest expense Income tax expense Total costs and expenses Net income Earnings per share Current Year $ 708,269 $ 432,044 219,563 1 Year Ago $ 558,912 12,041 9,207 $ 35,414 $ 363,293 141,405 12,855 8,384 525,937 $ 32,975 $ 2.03 672,855 $ 2.18 (1-a) Compute days' sales uncollected. (1-a) Compute days' sales uncollected. (1-b) For each ratio, determine if it improved or worsened in the current year. Complete this question by entering your answers in the tabs below. Required 1A Required 1B Compute days' sales uncollected. Current Year: 1 Year Ago: Days' Sales Uncollected Numerator: Denominator: Days = Days' Sales Uncollected = Days' sales uncollected 1 x Required 1A Required 1B > = = 0 days 0 days Earnings per share. $ 2.18 $ 2.03 (1-a) Compute days' sales uncollected. (1-b) For each ratio, determine if it improved or worsened in the current year. Complete this question by entering your answers in the tabs below. Required 1A Required 1B For each ratio, determine if it improved or worsened in the current year. Days' sales uncollected < Required 1A Required 1R. Simon Company's year-end balance sheets follow. At December 31 Assets Cash Accounts receivable, net Merchandise inventory Prepaid expenses Plant assets, net Total assets Liabilities and Equity Accounts payable Current Year 1 Year Ago 2 Years Ago $ 36,447 62,700 $ 31,180 89,600 114,000 10,041 300,001 82,000 9,567 278,960 $ 469,674 $ 38,748 50,000 56,000 4,305 254,447 $ 403,500 $ 544,822 $ 131,591 Long-term notes payable Common stock, $10 par value Retained earnings $ 76,994 104,784 162,500 125,396 $ 51,664 86,498 162,500 102,838 Total liabilities and equity 99,354 162,500 151,377 $ 544,822 $ 469,674 $ 403,500 The company's income statements for the current year and one year ago follow. Assume that all sales are on credit: For Year Ended December 31 Sales Cost of goods sold Other operating expenses Interest expense Income tax expense Total costs and expenses Net income Earnings per share Current Year $ 708,269 $ 432,044 219,563 1 Year Ago $ 558,912 12,041 9,207 $ 35,414 $ 2.18 $ 363,293 141,405 12,855 8,384 525,937 $ 32,975 $ 2.03 672,855 (2-a) Compute accounts receivable turnover. (2-a) Compute accounts receivable turnover. (2-b) For each ratio, determine if it improved or worsened in the current year. Complete this question by entering your answers in the tabs below. Required 2A Required 2B Compute accounts receivable turnover. Current Year: 1 Year Ago: Accounts Receivable Turnover Numerator: Denominator: = Accounts Receivable Turnover = Accounts receivable turnover = = times times (2-a) Compute accounts receivable turnover. (2-b) For each ratio, determine if it improved or worsened in the current year. Complete this question by entering your answers in the tabs below. Required 2A Required 2B For each ratio, determine if it improved or worsened in the current year. Accounts receivable turnover < Required 2A Required 2B> Simon Company's year-end balance sheets follow. At December 31 Assets Current Year 1 Year Ago 2 Years Ago Cash Accounts receivable, net $ 31,180 89,600 $ 36,447 62,700 $ 38,748 Merchandise inventory Prepaid expenses Plant assets, net Total assets Liabilities and Equity Accounts payable 114,000 10,041 300,001 82,000 9,567 278,960 $ 469,674 $ 544,822 $ 131,591 76,994 Long-term notes payable 99,354 104,784 Common stock, $10 par value 162,500 Retained earnings 125,396 Total liabilities and equity 162,500 151,377 $ 544,822 $ 469,674 50,000 56,000 4,305 254,447 $ 403,500 $ 51,664 86,498 162,500 102,838 $ 403,500 The company's income statements for the current year and one year ago follow. Assume that all sales are on credit: For Year Ended December 31 Sales Cost of goods sold Other operating expenses Interest expense Income tax expense Total costs and expenses Net income Earnings per share Current Year $ 708,269 $ 432,044 219,563 12,041 1 Year Ago $ 558,912 9,207 $ 35,414 $ 2.18 $ 363,293 141,405 12,855 8,384 $ 32,975 $ 2.03 672,855 525,937 (3-a) Compute inventory turnover. (3-b) For each ratio, determine if it improved or worsened in the current year. Complete this question by entering your answers in the tabs below. Required 3A Required 3B Compute inventory turnover. Current Year: 1 Year Ago: Inventory Turnover Numerator: Denominator: < Required 3A Inventory Turnover = Inventory turnover = times = times Required 3B > (3-a) Compute inventory turnover. (3-b) For each ratio, determine if it improved or worsened in the current year. Complete this question by entering your answers in the tabs below. Required 3A Required 3B For each ratio, determine if it improved or worsened in the current year. Inventory turnover < Required 3A Required 3R Simon Company's year-end balance sheets follow. At December 31 Assets Cash Accounts receivable, net Merchandise inventory Prepaid expenses Plant assets, net Total assets Liabilities and Equity Accounts payable Current Year 1 Year Ago 2 Years Ago $ 36,447 62,700 $ 31,180 89,600 114,000 10,041 300,001 82,000 9,567 278,960 $ 469,674 $ 544,822 $ 131,591 Long-term notes payable Common stock, $10 par value Retained earnings $ 76,994 104,784 162,500 125,396 Total liabilities and equity 99,354 162,500 151,377 $ 544,822 $ 469,674 $ 38,748 50,000 56,000 4,305 254,447 $ 403,500 $ 51,664 86,498 162,500 102,838 $ 403,500 The company's income statements for the current year and one year ago follow. Assume that all sales are on credit: For Year Ended December 31 Sales Cost of goods sold Other operating expenses Interest expense Income tax expense Total costs and expenses Net income Earnings per share Current Year $ 708,269 $ 432,044 219,563 12,041 1 Year Ago $ 558,912 9,207 $ 35,414 $ 363,293 141,405 12,855 8,384 525,937 $ 32,975 $ 2.03 672,855 $ 2.18 (4-a) Compute days' sales in inventory. (4-b) For each ratio, determine if it improved or worsened in the current year. Complete this question by entering your answers in the tabs below. Required 4A Required 4B Compute days' sales in inventory. Current Year: 1 Year Ago: Numerator: 1 Days' Sales In Inventory. Denominator: Days = Days' Sales In Inventory = Days' sales in inventory = days || = days < Required 4A Required 4B (4-a) Compute days' sales in inventory. (4-b) For each ratio, determine if it improved or worsened in the current year. Complete this question by entering your answers in the tabs below. Required 4A Required 4B For each ratio, determine if it improved or worsened in the current year. Days' sales in inventory Required 4A Required 4B Simon Company's year-end balance sheets follow. At December 31 Assets Cash Accounts receivable, net Merchandise inventory Prepaid expenses Plant assets, net Total assets Liabilities and Equity Accounts payable Current Year 1 Year Ago 2 Years Ago $ 32,994 99,529 123,912 10,842 303,351 $ 38,173 68,869 $ 40,583 55,216 61,181 90,095 10,537 284,247 $ 491,921 $ 570,628 $ 137,824 Long-term notes payable Common stock, $10 par value Retained earnings $ 83,966 114,273 162,500 131,182 Total liabilities and equity $ 570,628 $ 491,921 109,424 162,500 160,880 4,555 256,765 $ 418,300 $ 54,111 93,369 162,500 108,320 $ 418,300 The company's income statements for the current year and one year ago, follow. For Year Ended December 31 Sales Cost of goods sold Other operating expenses Interest expense Income tax expense Total costs and expenses Net income Earnings per share Current Year $ 741,816 $ 452,508 229,963 1 Year Ago $ 585,386 12,611 9,644 $ 37,090 $ 380,501 148,103 13,464 8,781 550,849 $ 34,537 $ 2.13 704,726 $ 2.28 (1) Compute debt and equity ratio for the current year and one year ago. Current Year: 1 Year Ago: Current Year: 1 Year Ago: Debt Ratio Numerator: Denominator: = = II = Debt Ratio Debt ratio % Equity Ratio Numerator: Denominator: = Equity Ratio = Equity ratio = % 1 = %
Step by Step Solution
There are 3 Steps involved in it
Step: 1

Get Instant Access to Expert-Tailored Solutions
See step-by-step solutions with expert insights and AI powered tools for academic success
Step: 2

Step: 3

Ace Your Homework with AI
Get the answers you need in no time with our AI-driven, step-by-step assistance
Get Started


