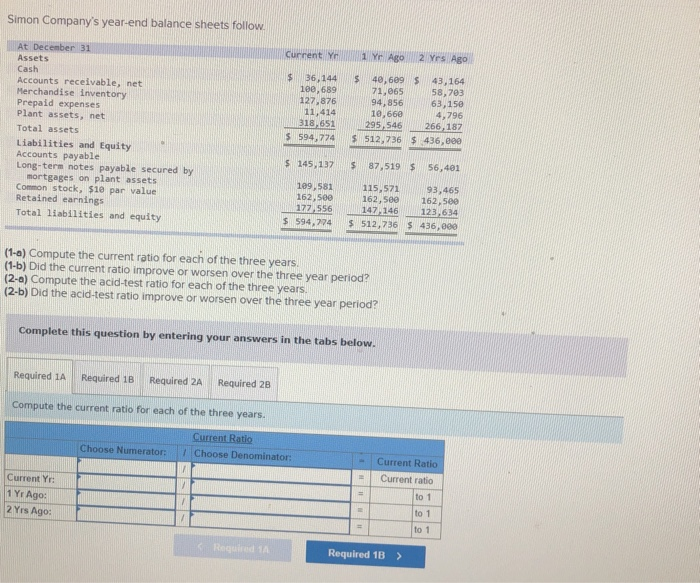
Simon Company's year-end balance sheets follow. Current Yr 1 Yr Ago 2 Yrs Ago $ 36,144 100,689 127,876 11,414 318,651 $ 594,774 $ 40,609 $ 43,164 71,065 58,703 94,856 63,150 10,660 4,796 295, 546 266,187 $ 512,736 $ 436,000 At December 31 Assets Cash Accounts receivable, net Merchandise inventory Prepaid expenses Plant assets, net Total assets Liabilities and Equity Accounts payable Long-term notes payable secured by mortgages on plant assets Common stock, $10 par value Retained earnings Total liabilities and equity $ 145,137 $ 87,519 $ 56,401 109,581 162,500 177,556 $ 594,774 115,571 162,500 147, 146 $ 512,736 93,465 162,500 123,634 S 436,000 (1-0) Compute the current ratio for each of the three years. (1-b) Did the current ratio improve or worsen over the three year period? (2-0) Compute the acid-test ratio for each of the three years. (2-b) Did the acid-test ratio improve or worsen over the three year period? Complete this question by entering your answers in the tabs below. Required 1A Required 1B Required 2A Required 28 Compute the current ratio for each of the three years. Current Ratio 7 Choose Denominator: Choose Numerator: - Current Ratio Current ratio Current Yr 1 Yr Ago: 2 Yrs Ago: Required 1B > Complete this question by entering your answers in the tabs below. Required 1A Required 1B Required 2A Required 28 Did the current ratio improve or worsen over the three year period? Current ratio Complete this question by entering your answers in the tabs below. Required 1A Required 18 Required 28 Compute the acid-test ratio for each of the three years. Acid:test ratio Choose Numerator Choose Denominator Acid Test Ratio Current Yet 1 Yt Ago: 2 Yrs ago Complete this question by entering your answers in the tabs below. Required 1A Required 18 Required 2A Required 2B Did the acid-test ratio improve or worsen over the three year period? Acid-test ratio