Question
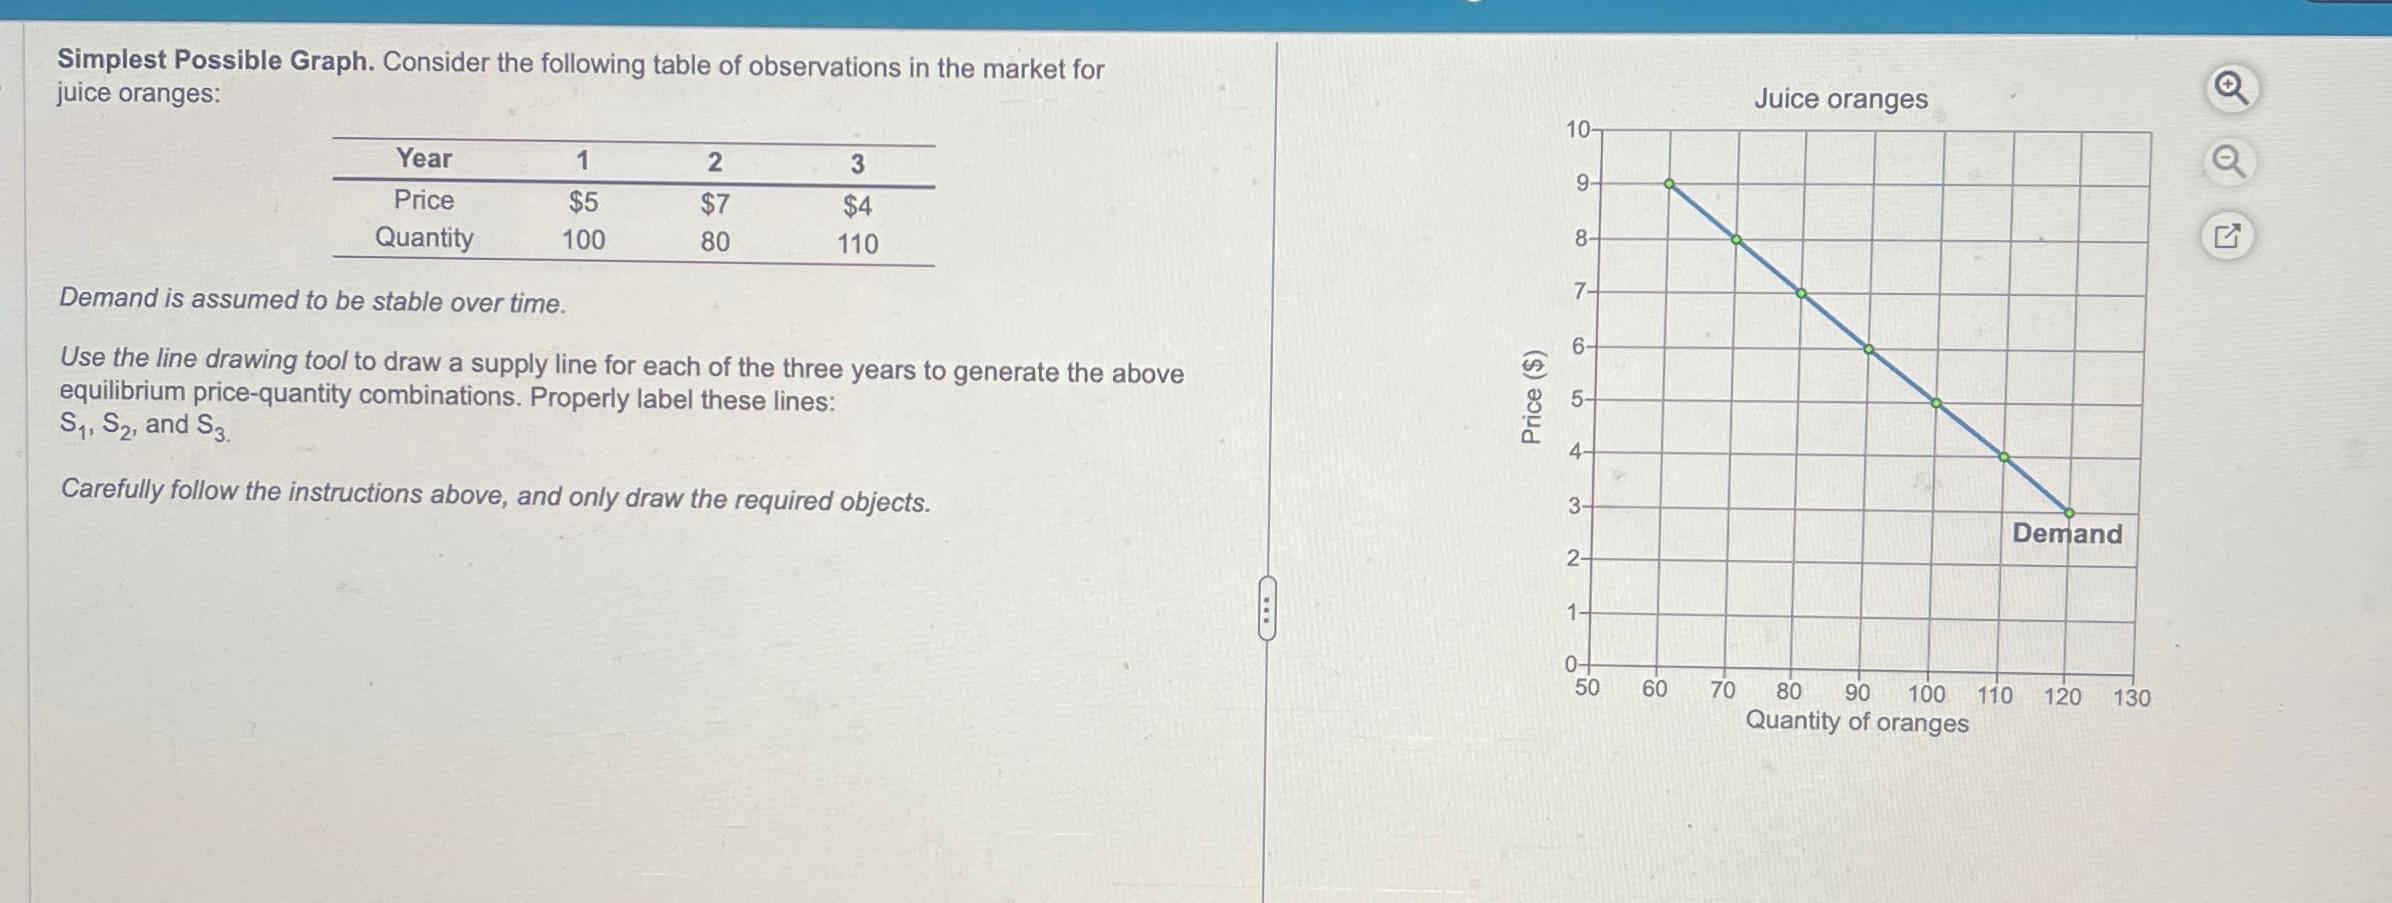
Simplest Possible Graph. Consider the following table of observations in the market for juice oranges: Year 1 2 3 Price $5 $7 $4 Quantity

Simplest Possible Graph. Consider the following table of observations in the market for juice oranges: Year 1 2 3 Price $5 $7 $4 Quantity 100 80 110 Demand is assumed to be stable over time. Use the line drawing tool to draw a supply line for each of the three years to generate the above equilibrium price-quantity combinations. Properly label these lines: S1, S2, and S3. Carefully follow the instructions above, and only draw the required objects. Price ($) 10- 9- 8- 7- 6- 5- 4- 3- 2- 1 0+ 50 Juice oranges Demand 60 60 70 80 90 100 110 Quantity of oranges 120 130
Step by Step Solution
There are 3 Steps involved in it
Step: 1

Get Instant Access to Expert-Tailored Solutions
See step-by-step solutions with expert insights and AI powered tools for academic success
Step: 2

Step: 3

Ace Your Homework with AI
Get the answers you need in no time with our AI-driven, step-by-step assistance
Get StartedRecommended Textbook for
Introduction to Operations Research
Authors: Frederick S. Hillier, Gerald J. Lieberman
10th edition
978-0072535105, 72535105, 978-1259162985
Students also viewed these Economics questions
Question
Answered: 1 week ago
Question
Answered: 1 week ago
Question
Answered: 1 week ago
Question
Answered: 1 week ago
Question
Answered: 1 week ago
Question
Answered: 1 week ago
Question
Answered: 1 week ago
Question
Answered: 1 week ago
Question
Answered: 1 week ago
Question
Answered: 1 week ago
Question
Answered: 1 week ago
Question
Answered: 1 week ago
Question
Answered: 1 week ago
Question
Answered: 1 week ago
Question
Answered: 1 week ago
Question
Answered: 1 week ago
Question
Answered: 1 week ago
Question
Answered: 1 week ago
Question
Answered: 1 week ago
Question
Answered: 1 week ago
Question
Answered: 1 week ago
View Answer in SolutionInn App


