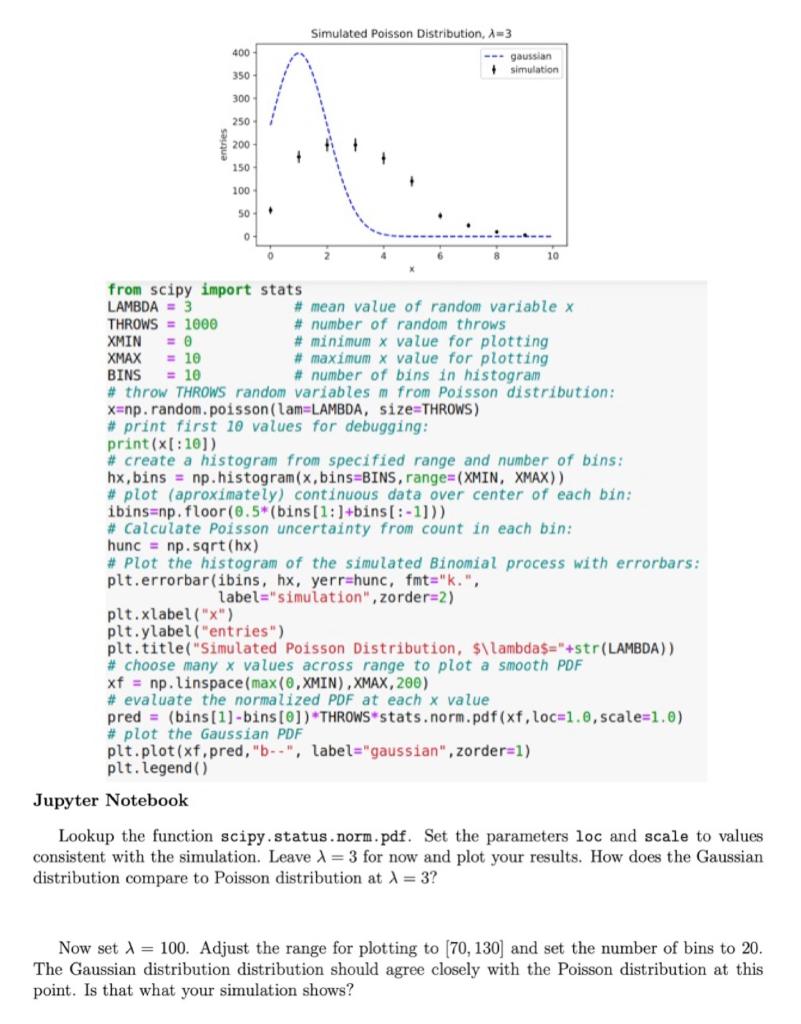
Simulated Poisson Distribution, A3 400 - gaussian + simulation 350 300 250 entries 200 150 100 50 . 0 0 2 10 from scipy import stats LAMBDA = 3 # mean value of random variable x THROWS = 1000 # number of random throws XMIN = 0 # minimum x value for plotting XMAX = 10 # maximum x value for plotting BINS = 10 # number of bins in histogram # throw THROWS random variables m from Poisson distribution: x=np. random.poisson (lam=LAMBDA, size=THROWS) # print first 10 values for debugging: print(x[:10)) # create a histogram from specified range and number of bins: hx, bins = np.histogram(x,bins=BINS, range=(XMIN, XMAX)) # plot (aproximately) continuous data over center of each bin: ibins=np.floor(0.5*(bins (1:)+bins[:-1])) # Calculate poisson uncertainty from count in each bin: hunc = np. sqrt(hx) # Plot the histogram of the simulated Binomial process with errorbars: plt.errorbar(ibins, hx, yerr-hunc, fmt="k.", label="simulation", zorder=2) plt.xlabel("x") plt.ylabel("entries") plt.title("Simulated Poisson Distribution, $\lambda$="+str(LAMBDA)) # choose many x values across range to plot a smooth PDF xf = np. linspace(max(0,XMIN), XMAX, 200) # evaluate the normalized PDF at each x value pred = (bins [1] -bins[0]) THROWS stats.norm.pdf(xf, loc=1.0, scale=1.0) # plot the Gaussian PDF plt.plot(xf pred, "-", label="gaussian",zorder=1) plt. legend() Jupyter Notebook Lookup the function scipy.status.norm.pdf. Set the parameters loc and scale to values consistent with the simulation. Leave = 3 for now and plot your results. How does the Gaussian distribution compare to Poisson distribution at X = 3? Now set = 100. Adjust the range for plotting to [70, 130) and set the number of bins to 20. The Gaussian distribution distribution should agree closely with the Poisson distribution at this point. Is that what your simulation shows? Simulated Poisson Distribution, A3 400 - gaussian + simulation 350 300 250 entries 200 150 100 50 . 0 0 2 10 from scipy import stats LAMBDA = 3 # mean value of random variable x THROWS = 1000 # number of random throws XMIN = 0 # minimum x value for plotting XMAX = 10 # maximum x value for plotting BINS = 10 # number of bins in histogram # throw THROWS random variables m from Poisson distribution: x=np. random.poisson (lam=LAMBDA, size=THROWS) # print first 10 values for debugging: print(x[:10)) # create a histogram from specified range and number of bins: hx, bins = np.histogram(x,bins=BINS, range=(XMIN, XMAX)) # plot (aproximately) continuous data over center of each bin: ibins=np.floor(0.5*(bins (1:)+bins[:-1])) # Calculate poisson uncertainty from count in each bin: hunc = np. sqrt(hx) # Plot the histogram of the simulated Binomial process with errorbars: plt.errorbar(ibins, hx, yerr-hunc, fmt="k.", label="simulation", zorder=2) plt.xlabel("x") plt.ylabel("entries") plt.title("Simulated Poisson Distribution, $\lambda$="+str(LAMBDA)) # choose many x values across range to plot a smooth PDF xf = np. linspace(max(0,XMIN), XMAX, 200) # evaluate the normalized PDF at each x value pred = (bins [1] -bins[0]) THROWS stats.norm.pdf(xf, loc=1.0, scale=1.0) # plot the Gaussian PDF plt.plot(xf pred, "-", label="gaussian",zorder=1) plt. legend() Jupyter Notebook Lookup the function scipy.status.norm.pdf. Set the parameters loc and scale to values consistent with the simulation. Leave = 3 for now and plot your results. How does the Gaussian distribution compare to Poisson distribution at X = 3? Now set = 100. Adjust the range for plotting to [70, 130) and set the number of bins to 20. The Gaussian distribution distribution should agree closely with the Poisson distribution at this point. Is that what your simulation shows


