Simulation for different options
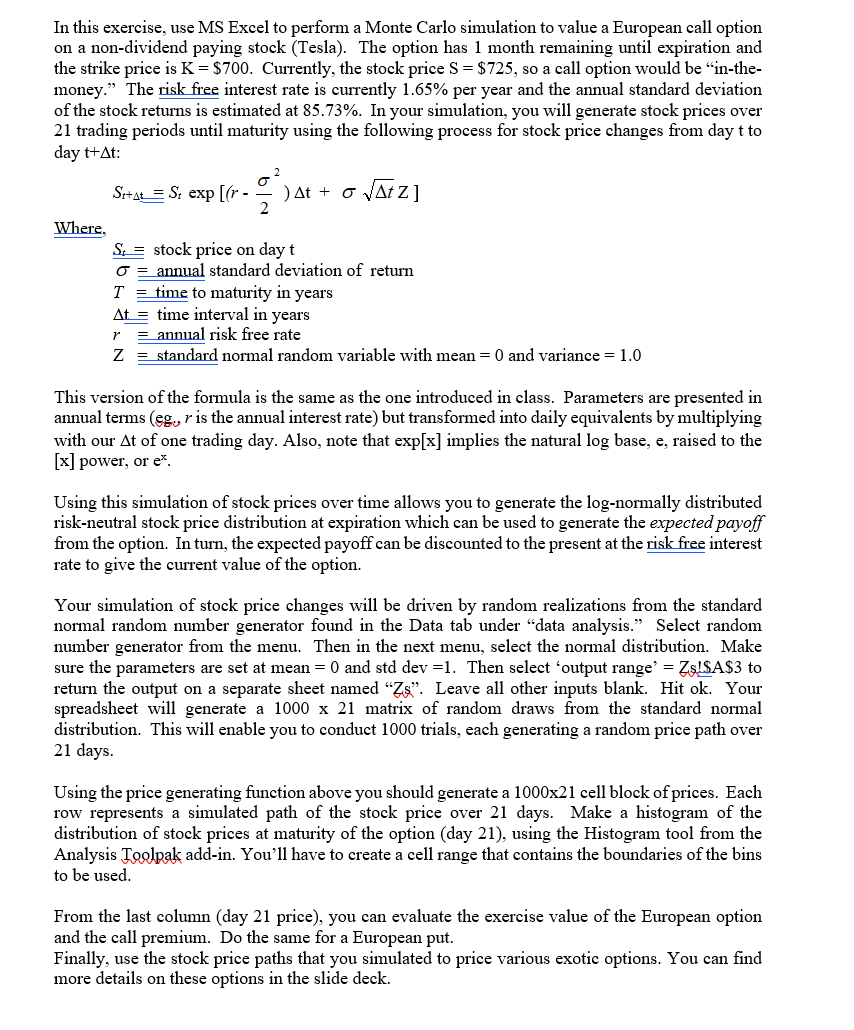
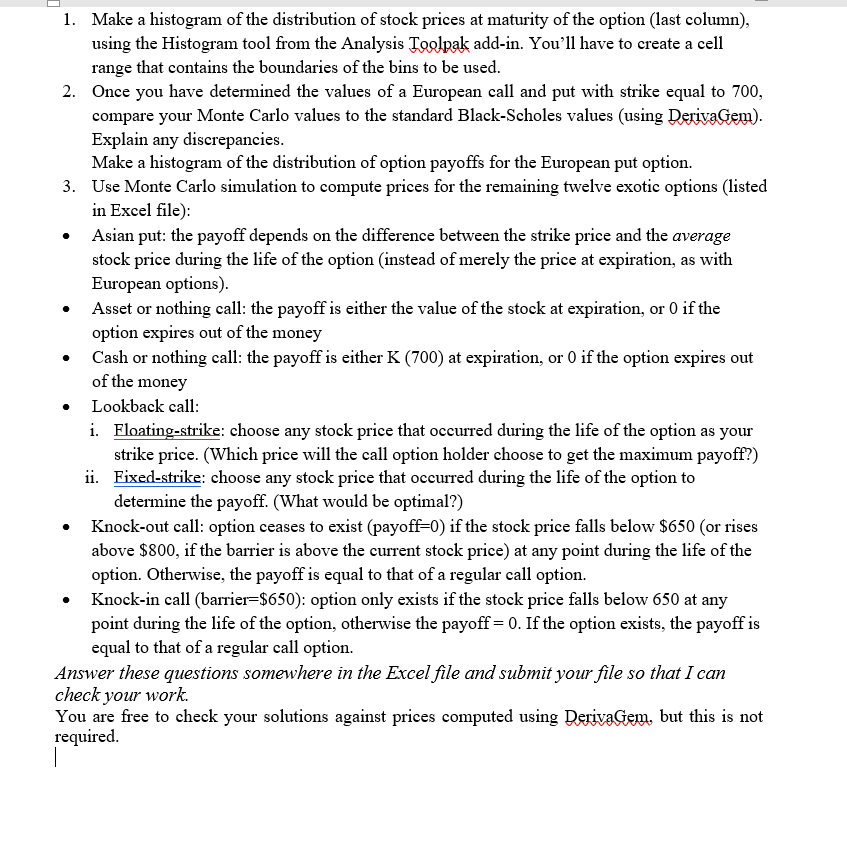
In this exercise, use MS Excel to perform a Monte Carlo simulation to value a European call option on a non-dividend paying stock (Tesla). The option has 1 month remaining until expiration and the strike price is K = $700. Currently, the stock price S = $725, so a call option would be in-the- money." The risk free interest rate is currently 1.65% per year and the annual standard deviation of the stock returns is estimated at 85.73%. In your simulation, you will generate stock prices over 21 trading periods until maturity using the following process for stock price changes from day t to day t+At: Se+s4= S: exp [(r- ) At + OVAZ] ( Where, S = stock price on dayt o = annual standard deviation of return T = time to maturity in years At = time interval in years r = annual risk free rate Z = standard normal random variable with mean = 0 and variance = 1.0 This version of the formula is the same as the one introduced in class. Parameters are presented in annual terms (eg, r is the annual interest rate) but transformed into daily equivalents by multiplying with our At of one trading day. Also, note that exp[x] implies the natural log base, e, raised to the [x] power, or ex Using this simulation of stock prices over time allows you to generate the log-normally distributed risk-neutral stock price distribution at expiration which can be used to generate the expected payoff from the option. In turn, the expected payoff can be discounted to the present at the risk free interest rate to give the current value of the option. Your simulation of stock price changes will be driven by random realizations from the standard normal random number generator found in the Data tab under "data analysis. Select random number generator from the menu. Then in the next menu, select the normal distribution. Make sure the parameters are set at mean = 0 and std dev =1. Then select 'output range' = Zs!$A$3 to return the output on a separate sheet named "Zs". Leave all other inputs blank. Hit ok. Your spreadsheet will generate a 1000 x 21 matrix of random draws from the standard normal distribution. This will enable you to conduct 1000 trials, each generating a random price path over 21 days. Using the price generating function above you should generate a 1000x21 cell block of prices. Each row represents a simulated path of the stock price over 21 days. Make a histogram of the distribution of stock prices at maturity of the option (day 21), using the Histogram tool from the Analysis Toolpak add-in. You'll have to create a cell range that contains the boundaries of the bins to be From the last column (day 21 price), you can evaluate the exercise value of the European option and the call premium. Do the same for a European put. Finally, use the stock price paths that you simulated to price various exotic options. You can find more details on these options in the slide deck. . 1. Make a histogram of the distribution of stock prices at maturity of the option (last column), using the Histogram tool from the Analysis Toolpak add-in. You'll have to create a cell range that contains the boundaries of the bins to be used. 2. Once you have determined the values of a European call and put with strike equal to 700, compare your Monte Carlo values to the standard Black-Scholes values (using Derivagem). Explain any discrepancies. Make a histogram of the distribution of option payoffs for the European put option. 3. Use Monte Carlo simulation to compute prices for the remaining twelve exotic options (listed in Excel file): Asian put the payoff depends on the difference between the strike price and the average stock price during the life of the option instead of merely the price at expiration, as with European options). Asset or nothing call: the payoff is either the value of the stock at expiration, or 0 if the option expires out of the money Cash or nothing call: the payoff is either K (700) at expiration, or 0 if the option expires out of the money Lookback call: i. Floating-strike: choose any stock price that occurred during the life of the option as your strike price. (Which price will the call option holder choose to get the maximum payoff?) ii. Fixed-strike: choose any stock price that occurred during the life of the option to determine the payoff. (What would be optimal?) Knock-out call: option ceases to exist (payoff=0) if the stock price falls below $650 (or rises above $800, if the barrier is above the current stock price) at any point during the life of the option. Otherwise, the payoff is equal to that of a regular call option. Knock-in call (barrier=$650): option only exists if the stock price falls below 650 at any point during the life of the option, otherwise the payoff = 0. If the option exists, the payoff is equal to that of a regular call option. Answer these questions somewhere in the Excel file and submit your file so that I can check your work. You are free to check your solutions against prices computed using Derivagem, but this is not required. | . In this exercise, use MS Excel to perform a Monte Carlo simulation to value a European call option on a non-dividend paying stock (Tesla). The option has 1 month remaining until expiration and the strike price is K = $700. Currently, the stock price S = $725, so a call option would be in-the- money." The risk free interest rate is currently 1.65% per year and the annual standard deviation of the stock returns is estimated at 85.73%. In your simulation, you will generate stock prices over 21 trading periods until maturity using the following process for stock price changes from day t to day t+At: Se+s4= S: exp [(r- ) At + OVAZ] ( Where, S = stock price on dayt o = annual standard deviation of return T = time to maturity in years At = time interval in years r = annual risk free rate Z = standard normal random variable with mean = 0 and variance = 1.0 This version of the formula is the same as the one introduced in class. Parameters are presented in annual terms (eg, r is the annual interest rate) but transformed into daily equivalents by multiplying with our At of one trading day. Also, note that exp[x] implies the natural log base, e, raised to the [x] power, or ex Using this simulation of stock prices over time allows you to generate the log-normally distributed risk-neutral stock price distribution at expiration which can be used to generate the expected payoff from the option. In turn, the expected payoff can be discounted to the present at the risk free interest rate to give the current value of the option. Your simulation of stock price changes will be driven by random realizations from the standard normal random number generator found in the Data tab under "data analysis. Select random number generator from the menu. Then in the next menu, select the normal distribution. Make sure the parameters are set at mean = 0 and std dev =1. Then select 'output range' = Zs!$A$3 to return the output on a separate sheet named "Zs". Leave all other inputs blank. Hit ok. Your spreadsheet will generate a 1000 x 21 matrix of random draws from the standard normal distribution. This will enable you to conduct 1000 trials, each generating a random price path over 21 days. Using the price generating function above you should generate a 1000x21 cell block of prices. Each row represents a simulated path of the stock price over 21 days. Make a histogram of the distribution of stock prices at maturity of the option (day 21), using the Histogram tool from the Analysis Toolpak add-in. You'll have to create a cell range that contains the boundaries of the bins to be From the last column (day 21 price), you can evaluate the exercise value of the European option and the call premium. Do the same for a European put. Finally, use the stock price paths that you simulated to price various exotic options. You can find more details on these options in the slide deck. . 1. Make a histogram of the distribution of stock prices at maturity of the option (last column), using the Histogram tool from the Analysis Toolpak add-in. You'll have to create a cell range that contains the boundaries of the bins to be used. 2. Once you have determined the values of a European call and put with strike equal to 700, compare your Monte Carlo values to the standard Black-Scholes values (using Derivagem). Explain any discrepancies. Make a histogram of the distribution of option payoffs for the European put option. 3. Use Monte Carlo simulation to compute prices for the remaining twelve exotic options (listed in Excel file): Asian put the payoff depends on the difference between the strike price and the average stock price during the life of the option instead of merely the price at expiration, as with European options). Asset or nothing call: the payoff is either the value of the stock at expiration, or 0 if the option expires out of the money Cash or nothing call: the payoff is either K (700) at expiration, or 0 if the option expires out of the money Lookback call: i. Floating-strike: choose any stock price that occurred during the life of the option as your strike price. (Which price will the call option holder choose to get the maximum payoff?) ii. Fixed-strike: choose any stock price that occurred during the life of the option to determine the payoff. (What would be optimal?) Knock-out call: option ceases to exist (payoff=0) if the stock price falls below $650 (or rises above $800, if the barrier is above the current stock price) at any point during the life of the option. Otherwise, the payoff is equal to that of a regular call option. Knock-in call (barrier=$650): option only exists if the stock price falls below 650 at any point during the life of the option, otherwise the payoff = 0. If the option exists, the payoff is equal to that of a regular call option. Answer these questions somewhere in the Excel file and submit your file so that I can check your work. You are free to check your solutions against prices computed using Derivagem, but this is not required. |